Win rate is the share of outcomes that ended in a win, expressed as a percentage. The core formula is wins divided by total decided events, multiplied by 100. In sports that means wins ÷ total games; in trading it is winning trades ÷ total trades; in sales it is closed-won deals ÷ total opportunities. Ties usually count as half a win, and each context has its own twist worth knowing before you trust the number.
TL;DR:
- A win rate can be misleading if not specified as opportunity-based or closed-only, with differences reaching nearly 9 percentage points in some cases.
- In trading, a strategy risking one unit to gain two only requires about a 33.3% win rate to break even, making low win rates still profitable if reward ratios are favorable.
- Sales win rates are heavily affected by the chosen denominator; using total opportunities versus only closed deals can significantly alter the reported percentage.
- Small sample sizes under roughly 30 outcomes make it risky to draw strong conclusions from minor fluctuations in win percentages.
- Proper forecasting requires recording individual deal assumptions and cohort analysis, not just relying on a single aggregated win rate statistic.
Table of Contents
- Win rate calculation formulas for sports, trading, and sales
- Step-by-step examples: sports, trading, and sales win rates
- Is your win rate good? Why context decides the answer
- Common mistakes in win rate reporting (and how to avoid them)
- Turning win rate into a forecast you can defend
- Which calculators and templates actually help here
- What the numbers actually tell revenue leaders
- A forecast built on traceable win rate, not a black box
- Sources
- FAQ
Win rate calculation formulas for sports, trading, and sales
Each field applies the same basic ratio, but the denominator and the treatment of edge cases change what the number actually tells you.
Sports, where games rarely end in a draw:
- Wins ÷ total games × 100 = win percentage.
- With ties in play: (wins + 0.5 × ties) ÷ total games × 100. Baseball, football, and hockey all use variants of this ties-as-half-win convention.
- Some leagues report the result as a decimal (a team “at .667”) rather than a percentage. Both describe the same figure; baseball tends to use decimals, football and basketball tend to use percentages.
Trading, where the number that matters most isn’t the win rate itself but the win rate you need to break even:
- Breakeven win rate = risk ÷ (risk + reward), or equivalently 1 ÷ (1 + reward:risk ratio).
- A strategy risking £1 to make £2 (a 1:2 risk:reward) only needs to win about a third of trades to break even, per the breakeven calculation formula. This relationship is exactly what breakeven calculators are built to solve.
- The practical point: a “low” win rate can still be a profitable strategy if the reward per win is large enough.
Sales, where the same label can mean two different things depending on the denominator:
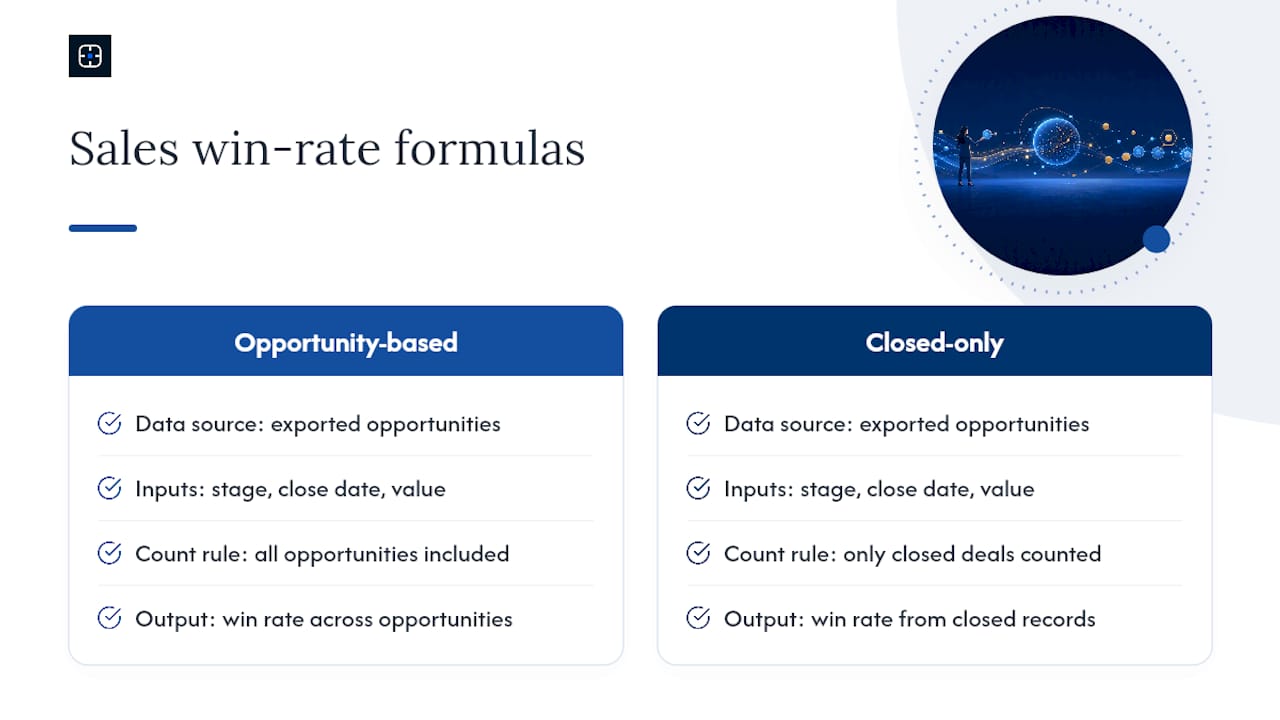
- Opportunity-based: closed-won ÷ total opportunities pursued in a period, including deals still open or lost, reflecting true conversion.
- Closed-only: closed-won ÷ (closed-won + closed-lost), excluding open pipeline, so often results in a higher percentage and answers a narrower question about finished deals.
- Klipfolio’s breakdown explains these variants in detail and is a recommended read before standardizing on one to avoid confusion.
Step-by-step examples: sports, trading, and sales win rates
Numbers make this concrete. Here is each formula run through a realistic scenario.
-
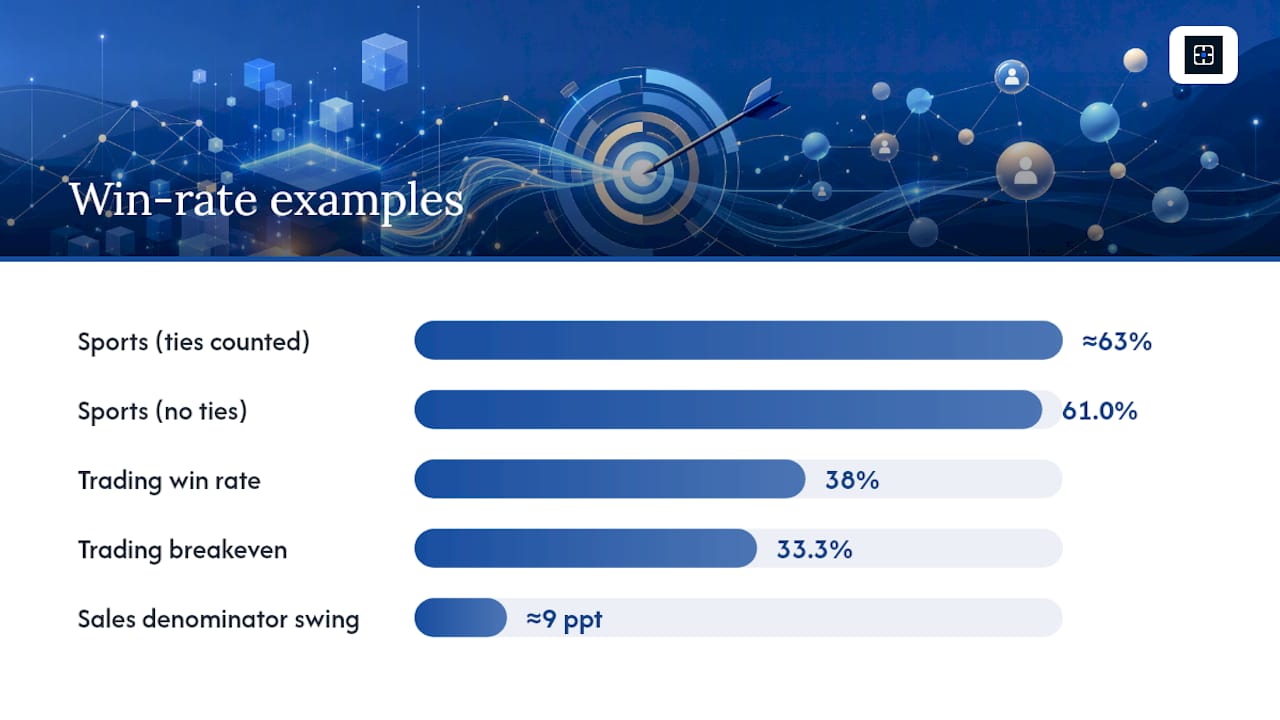
Sports. A team plays several dozen games, wins some, loses others, and ties a few. Win percentage is calculated by adding wins to half the ties, dividing by total games, and multiplying by 100. For example, if ties count as half a win, the winning percentage can be in the low 60%s range. In decimal form, that’s around .63. Drop the tie adjustment and you’d wrongly report 61.0%, a two-point error that matters in a tight standings race.
-
Trading. A trader logs 100 trades and wins 38 of them, for a 38% win rate. Their strategy risks £100 to target £200 profit, a 1:2 risk:reward ratio. Breakeven win rate = 1 ÷ (1 + 2) = 33.3%. Because 38% clears the 33.3% breakeven threshold, the strategy is profitable over this sample, even though “only winning a third of the time” sounds weak on its own.
-
Sales. A rep works on a batch of opportunities in a quarter, some are won, some lost, and some remain open. Calculating win rate including all opportunities completed and open results in a lower percentage than calculating only from closed deals. Differences between these methods can cause misunderstandings if not clearly specified.
Statistic to remember: in the sales example above, switching denominators alone swings the reported win rate by nearly 9 percentage points on identical underlying data. That’s the size of error a vague report can hide.
Win-loss ratio is a close cousin worth distinguishing. Where win rate is wins ÷ total, win-loss ratio is wins ÷ losses alone, ignoring ties and opens. The two describe the same underlying results but answer slightly different questions, so state which one you’re using.
Is your win rate good? Why context decides the answer
There’s no universal benchmark, because the number that counts as strong in one setting is mediocre in another. Win rate functions best as a lagging indicator that prompts you to look deeper, not a target you chase in isolation.
A few adjustments change what a raw percentage actually tells you:
- Sample size. A win rate calculated on 8 deals can swing 12 points if one outcome flips. Treat anything under roughly 30 closed outcomes as directional, not decisive.
- Deal value. Winning 40% of deals by count means little if the wins are your smallest accounts. Money-weighted win rate (won value ÷ total value pursued) tells you whether you’re winning the deals that matter.
- Cohorting. Splitting results by month, product line, or channel usually reveals that an average masks a real trend, such as a new rep improving steadily or one segment quietly collapsing.
Pro Tip: *Before reacting to a win rate move of a few points, check the sample size behind it first.
Common mistakes in win rate reporting (and how to avoid them)
Most win rate disputes in a revenue team come down to reporting habits, not maths errors. Fix these five and most disagreements disappear.
- Stop using unlimited rolling totals. A single all-time win rate smooths over real change. Monthly or quarterly cohorts expose whether performance is improving, declining, or seasonal.
- State the numerator and denominator every time. “Win rate: 24%” means nothing without knowing whether it’s opportunity-based or closed-only, and over what period.
- Don’t mix pipeline-stage denominators across reports. Comparing a win rate calculated from “stage 2 onward” against one calculated from “all leads” produces a false trend.
- Weight by deal value only when value varies meaningfully. For a team with roughly uniform deal sizes, weighting adds complexity without adding insight.
- Treat small cohorts as anecdotal. Below roughly 30 closed outcomes, describe the result in words (“early signs are positive”) rather than a precise percentage that implies more confidence than the sample supports.
Turning win rate into a forecast you can defend
Win rate is an input to a forecast, not a forecast itself. A single blended percentage applied to open pipeline value tells a CRO almost nothing about which specific deals are actually going to close, and that gap is exactly where most commit numbers fall apart. The fix isn’t a smarter percentage. It’s recording the assumptions behind each deal so the final number can be checked, not just trusted.
A commit number built from win rate alone is a guess with decimal places. A commit number built from recorded, per-deal assumptions tied to CRM signals is something you can walk a board through, line by line, and defend when someone asks “why this figure and not another.”
Three practical steps make win rate usable in forecasting rather than decorative:
- Map win rate by cohort (stage, segment, rep tenure) rather than as one company-wide figure.
- Record the specific assumption behind each deal’s score, not just the aggregate rate.
- Run a sensitivity check: if win rate moved 5 points in either direction, how much would the commit number move?
Commitcontrol’s Sales Forecast Miss ROI Calculator quantifies what a missed commit actually costs, and its leadership transition guidance covers how incoming sales leaders rebuild trust in a forecast that’s been running on gut feel.
Which calculators and templates actually help here
You don’t need custom software to get a reliable win rate. A basic spreadsheet with wins, losses, and ties as separate columns handles sports and games in seconds. For trading, breakeven calculators that take your risk:reward ratio and return the win rate you need to stay profitable are worth bookmarking, and most general win-rate tools also calculate the loss rate and streak odds automatically.
For sales, the fastest reliable method is exporting opportunity records from Salesforce with stage, close date, and value fields, then building both the opportunity-based and closed-only formulas side by side so nobody has to guess which one a report is using.
What the numbers actually tell revenue leaders
Most win rate advice treats the metric as a scoreboard: higher is better, track it monthly, done. That misses the real value. Win rate is diagnostic, not evaluative. A falling win rate doesn’t tell you your team is worse; it tells you to go and look at why, deal by deal, cohort by cohort.
The conventional advice to “improve your win rate” is close to useless on its own, because a blended percentage hides which segment, rep, or deal stage is actually driving the change. Sales teams that treat win rate as a single KPI tend to chase the average and miss the outlier cohort dragging it down.
If there’s one priority worth taking from this, it’s discipline in denominators before anything else. Get the opportunity-based versus closed-only distinction wrong once in a board deck, and every number that follows loses credibility, however accurate the underlying maths was. Precision in what you’re measuring matters more than sophistication in how you calculate it.
— Brian
A forecast built on traceable win rate, not a black box
Commitcontrol is the deterministic alternative to forecasting tools that hand you a probability with no visible reasoning behind it. Where most vendors rely on models you can’t inspect, Commitcontrol ties every deal score directly to signals already sitting in your Salesforce instance, so the same inputs always produce the same score and a human can trace exactly why a deal moved.

That matters most in exactly the scenario this article has been walking through: a win rate that looks fine in aggregate but hides a stalled segment, an inflated commit, or a rep padding their number ahead of quarter end. Commitcontrol surfaces which deals are driving the change and lets you defend the resulting commit number with evidence, not a confidence interval nobody can audit. If your last forecast miss cost more than a difficult board conversation, run the numbers through the Sales Forecast Miss ROI Calculator and see what a defensible commit is worth to your team.
Sources
- Winning percentage — Wikipedia
- Win Rate Calculator - Calculate Your Win % — InfinityCalculator
- What is win rate and how to calculate it? — Klipfolio
FAQ
How is a win rate calculated?
Divide the number of wins by the total number of decided outcomes (wins plus losses, or wins, losses, and ties), then multiply by 100. In sports, ties usually count as half a win in the numerator.
How do I calculate my win percentage?
Use wins ÷ total games × 100 for a simple percentage, or (wins + 0.5 × ties) ÷ total games × 100 if ties are involved. In sales, decide first whether your denominator is all opportunities pursued or only closed opportunities.
Is a 30% win rate good?
It depends entirely on context.
Recommended
Editorial content. All metrics are Salesforce-derived and reviewed for accuracy. Not a substitute for professional judgment.
See the same discipline applied to your pipeline.
CommitControl derives every figure from your own Salesforce data. Nothing is invented, and every number traces back to the record it came from. Connect Salesforce and the same view runs live on your data within 24 hours.
Evaluate CommitControl