
Win rate analysis is the practice of tracking closed-won deals against total opportunities to see whether your sales motion actually converts, and it only works if you fix the denominator and clean up CRM stage data first. Get those two things wrong and every downstream number, forecast, quota, coverage ratio, is built on sand. The one action to take this week: audit what counts as an “opportunity” in your pipeline report, then check it against what your CRM actually enforces at each stage.
TL;DR:
- Using a consistent denominator rule, such as only qualified opportunities or closed deals, is essential for accurate win rate measurement over time.
- Segmenting win rate by factors like rep, product, deal size, or lead source reveals specific gaps that can be targeted for improvement.
- A typical healthy win rate ranges from 20% to 35%, but it varies widely based on deal complexity, industry, and sales process, making internal trends more relevant than industry benchmarks.
- Improving win rate relies on early qualification, capturing loss reasons, targeted coaching, and disciplined experiments rather than new technology.
- Reliable reporting requires enforcing mandatory CRM fields, pairing win rate with other KPIs, and using deterministic scoring to ensure forecast accuracy and inspect deal-by-deal signals.
Table of Contents
- What is win rate and how do you calculate it?
- What should the win rate denominator include?
- How do you segment win rate for real insight?
- Is 40% a good win rate? What benchmarks actually mean
- How do you actually improve win rate?
- How do you measure and report win rate reliably?
- How deterministic scoring changes win rate analysis
- What a VP Sales should do with this, this quarter
- Where CommitControl fits once your win rate is measured
- Sources
- FAQ
What is win rate and how do you calculate it?
Win rate measures how many opportunities you close as won against how many you pursued in total. Get the denominator wrong and the number lies to you, which is why the definition matters more than most sales teams treat it.
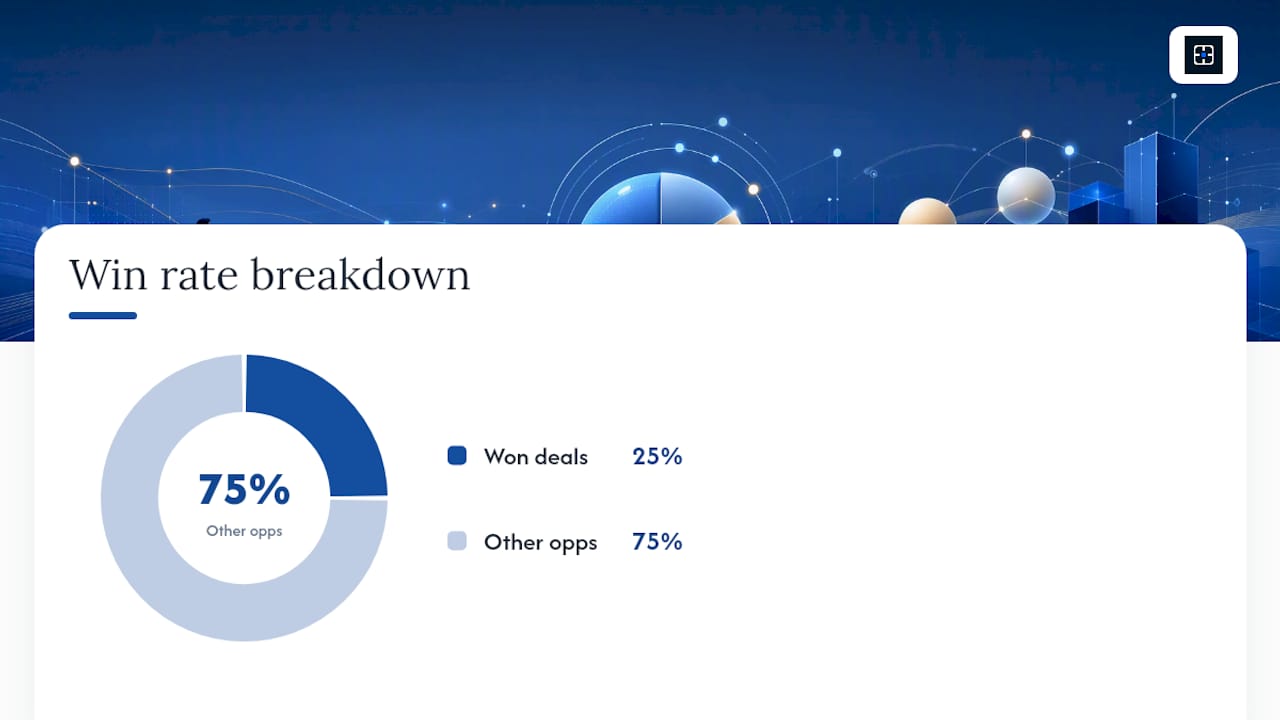
A “won” deal is one marked closed-won in your CRM with a signed contract or purchase order attached. An “opportunity” is any deal that entered your pipeline and reached a defined qualification stage, not just any lead a rep logged.
Two standard formulas exist, and they answer different questions.
- Count-based win rate: (Number of deals won ÷ Total number of opportunities) × 100. Ten deals closed from 40 opportunities gives you a 25% win rate.
- Value-based win rate: (Value of deals won ÷ Total value of opportunities) × 100. This matters when deal sizes vary widely, since a single £200,000 loss can mask a strong count-based number.
Run both according to Fullcast’s guide to measuring win rate, and report them for a fixed period (quarterly, matched to your forecast cycle) so trend comparisons mean something.
What should the win rate denominator include?
This is where most win rate figures fall apart, and it happens quietly. Three common denominator choices produce three very different numbers from the same pipeline.
- All opportunities created, including ones later disqualified. This drags your win rate down and rewards nothing.
- Qualified opportunities only, meaning deals that passed a defined qualification gate (budget confirmed, timeline set, decision maker engaged). This is the number boards actually want to see.
- Opportunities closed in the period (won plus lost), excluding anything still open. This is the cleanest denominator for a reporting period, but it ignores stalled deals sitting untouched for months.
Stalled or “zombie” deals distort every version. A deal sitting in stage three for 180 days with no activity should not count as an active opportunity, yet it often does because nobody purged it.
Pro Tip: Pick one denominator rule, write it down in your sales operations’ playbook, and apply it to every board report for a full year before you compare year-over-year trends. Switching definitions mid-year is how “win rate improved” claims get torn apart in a board meeting.
How do you segment win rate for real insight?
A single company-wide win rate tells you almost nothing useful. A segmented breakdown is where the actionable signal actually lives, and it takes five cuts to find it.
- By rep: identifies coaching gaps. A rep at 15% while the team averages 28% needs pipeline review, not a pep talk.
- By product or product line: reveals which offerings need better positioning, pricing, or sales enablement material.
- By deal size: enterprise deals often close slower and lower (multiple stakeholders, longer cycles) while smaller deals close faster and higher. Blending them hides both patterns.
- By sales stage entry point: deals that skip qualification and jump straight to proposal usually lose more, which flags a qualification problem upstream.
- By lead source and industry: shows where marketing and sales are actually aligned, and where they are not.
Set up a simple cohort query in your CRM or BI tool: group closed deals by the segment you care about, calculate win rate for each cohort over a rolling quarter, and flag any cohort more than five points off the company average. Review that output monthly alongside loss reasons, because a segment with a falling win rate and a repeating loss reason is your next fire to put out. According to Indeed’s guide to win-loss analysis, structured loss-reason capture is what turns a segmentation exercise into an action plan instead of a spreadsheet nobody reopens.
Is 40% a good win rate? What benchmarks actually mean
A healthy B2B win rate on qualified opportunities typically sits in the 20% to 35% range, but that range moves with deal size, sales motion, and industry. A transactional SMB motion with short cycles often runs higher. Complex enterprise sales with multiple stakeholders often run lower, even when the team is executing well.
Benchmarks depend heavily on deal size, sales motion, and industry, so treat any single-number target with caution.
Chasing an industry average is the wrong instinct. Your own trailing 12-month win rate, segmented and tracked quarter over quarter, tells you more than any external benchmark ever will. If your qualified win rate has held steady at 24% for three quarters and now drops to 18%, that is the number to interrogate, not whether 24% beats some report you read. Use your internal trend to set pipeline coverage targets and quota, not a borrowed figure from a company with a different average deal size.
How do you actually improve win rate?
Eight interventions move the number, and none require a new tech stack.
- Tighten qualification and disqualify early. Tighter qualification means the win rate denominator becomes real, winnable opportunities, and reps stop burning cycles on deals that never had a chance, a point Pulse RevOps makes directly.
- Multi-thread accounts before you need to. Deals with a single contact stall or die when that person changes roles. Engage the economic buyer early, not after the deal is already at risk.
- Capture consistent loss reasons on every closed-lost deal. Lost deals are cheap market research; review them monthly, not annually, and look for repeating patterns rather than one-off excuses.
- Turn demos into business cases your champion can use internally. A champion without ammunition to sell your deal upward inside their own company is a champion who goes quiet.
- Coach deal by deal in pipeline reviews, not rep by rep in generic terms. “Who’s the economic buyer on this specific deal?” beats “how’s your pipeline looking?”
- Track discounting as a companion metric. A rising win rate paired with a rising average discount is not a win rate improvement. It is deals being bought, not earned.
- Run targeted playbooks for your weakest segments rather than one generic sales process for every deal size and vertical.
- Define one experiment per quarter and measure the lift. Change qualification criteria for one segment, hold everything else constant, and compare win rate before and after.
Pro Tip: Run one experiment at a time. Change qualification criteria and multi-threading requirements in the same quarter and you will never know which lever actually moved the number.
How do you measure and report win rate reliably?
Reliable win rate reporting depends on data hygiene before it depends on any dashboard, and that order matters more than most RevOps teams admit.
- Enforce mandatory fields at each stage gate. A deal cannot advance to “proposal” without a confirmed budget field filled in. This alone kills a large share of denominator noise.
- Require a closed-lost reason on every lost deal, selected from a fixed dropdown list, not a free text field nobody reads later.
- Pair win rate with companion KPIs on the same dashboard: pipeline coverage ratio, average discount, and time-in-stage, so you can see whether wins are earned or bought, a pairing Klipfolio recommends for exactly this reason.
- Build the quick Excel check every RevOps analyst should know:
=COUNTIFS(Stage,"Closed Won")/COUNTIFS(Stage,"Closed Won","Closed Lost")gives count-based win rate on closed deals instantly, no BI tool required. - Automate the dashboard once the CRM hygiene rules hold; run manual audits quarterly even after automation, because stage definitions drift as teams change.
A structured reporting rhythm like this pairs well with the kind of management reporting discipline finance teams already run for other KPIs.
How deterministic scoring changes win rate analysis
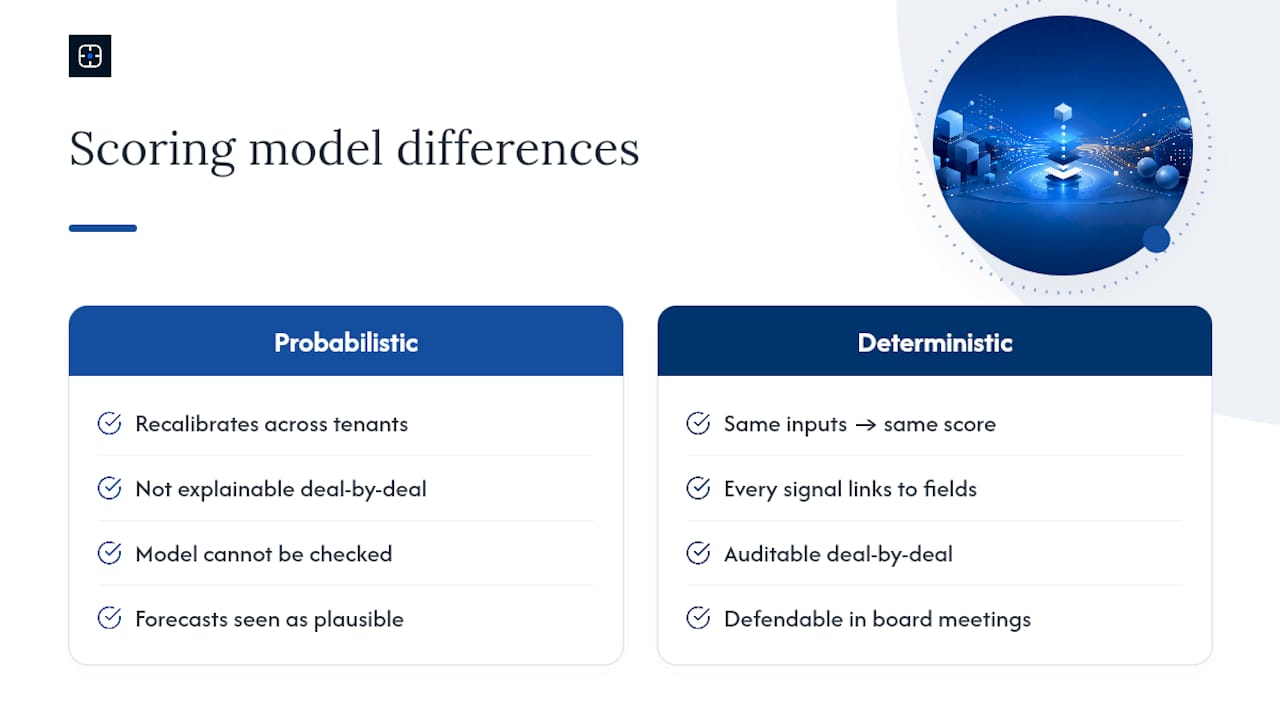
Here is the problem most VPs and CROs have lived through: your forecast called £1.2 million for the quarter. It landed at £1.7 million, or £700,000, and nobody can tell you why before the deal closed. Deals slip stages without explanation. Reps pad commits because the scoring model behind the forecast cannot be checked, so nobody argues with it until it is wrong.
Most vendors rely on probabilistic models that recalibrate across tenants and cannot always be explained deal by deal. Commitcontrol takes a different approach: deterministic scoring that ties every number back to specific Salesforce fields. The same inputs always produce the same score. Every signal traces to a field you can open and inspect. A human still owns the final call on each deal, the tool shows the reasoning, not a black box.
Deterministic, auditable scoring ties every forecastable number back to CRM signals, which is what makes a number defendable in a board meeting rather than just plausible.
What a VP Sales should do with this, this quarter
You have been burned by vendors promising accuracy they could not explain when the board asked how a number was built. That scepticism is earned, not paranoia. Fix three things now: pin down your denominator rule, enforce CRM stage hygiene, and run a two-week loss-reason review before your next forecast call. The section below explains where Commitcontrol fits if you want a tool that makes that process repeatable.
— Brian
Where CommitControl fits once your win rate is measured
CommitControl is the option for revenue leaders who want their win rate and forecast numbers defensible in the room, not just plausible on a slide. Every score traces back to your own Salesforce data, calculated with fixed logic, never calibrated against other companies’ pipelines, so the reasoning behind any number is always open to inspection.
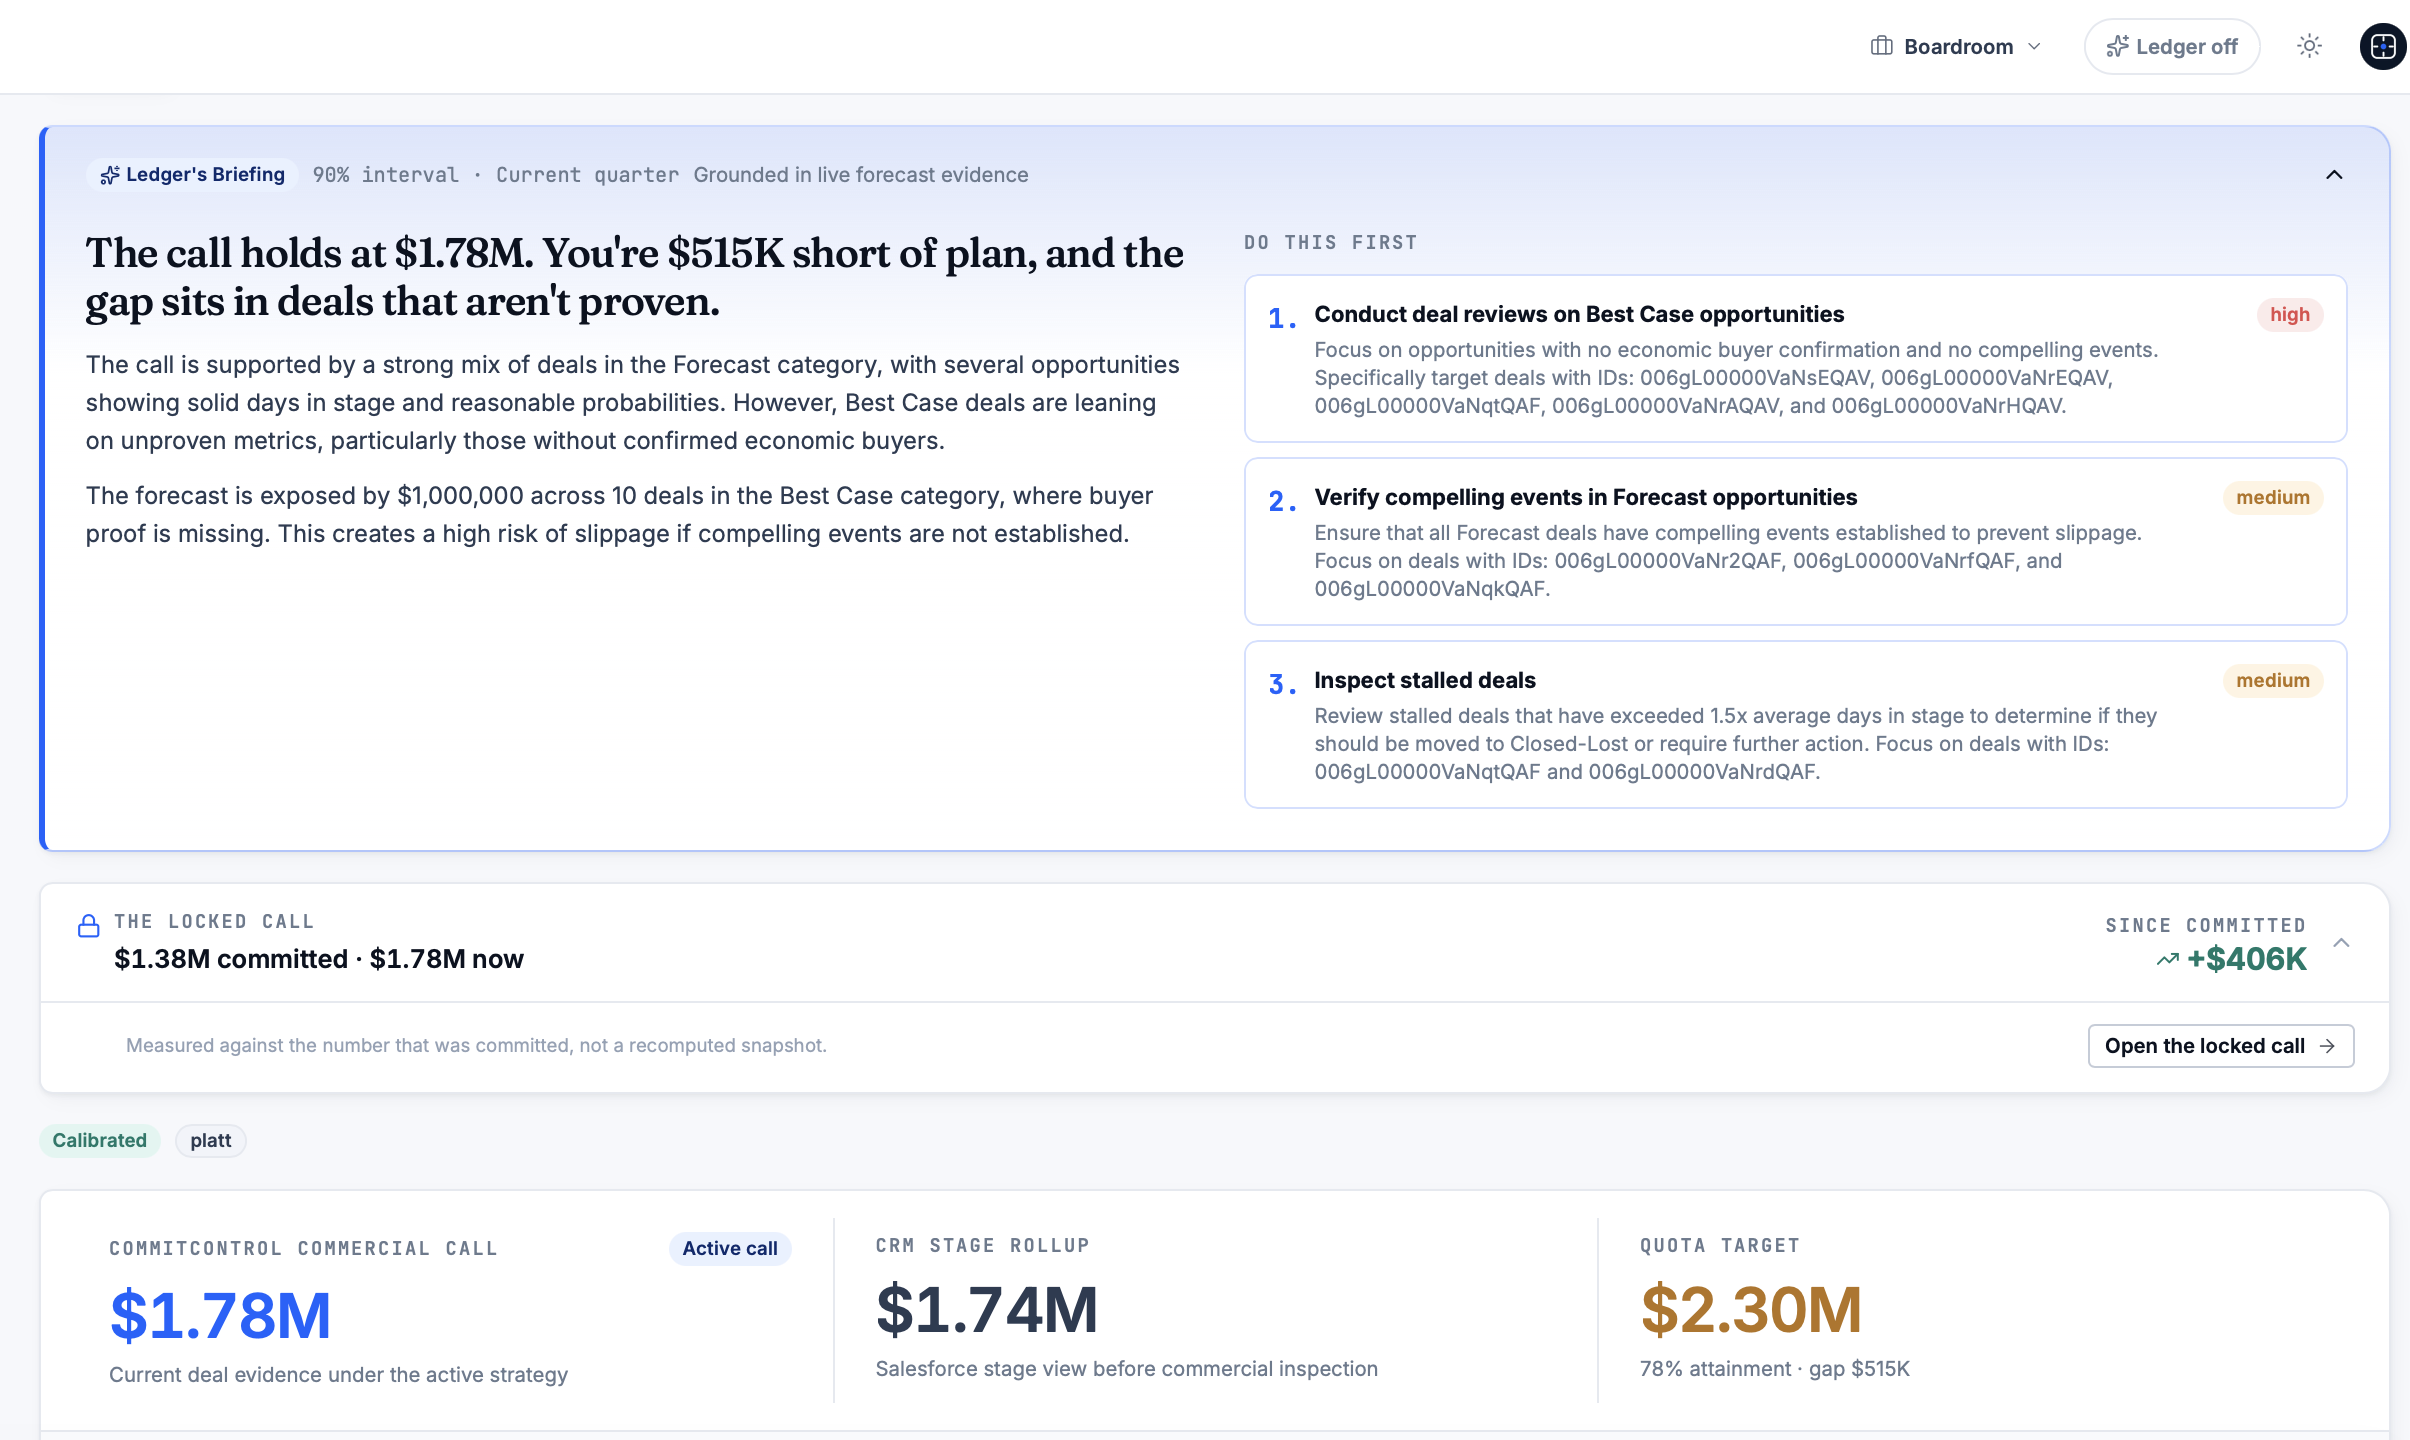
If your team is mid-transition, a new sales leader inheriting an unexplained pipeline, or a board asking hard questions about a forecast miss, the Sales Leadership Transition solution resets the process without changing how reps work day to day. If you want to quantify what a forecast miss actually costs before you commit to any tool, the forecast miss ROI calculator does the maths for you. Plans start with the Insight option and scale upward; current prices are available on the CommitControl pricing page. If your data hygiene is still a mess, hire help to fix the CRM first; a scoring tool cannot fix bad inputs. Once the inputs are clean, book a walkthrough and see your own pipeline scored.
Sources
- 5 Levers That Actually Move Your Win Rate | Pulse RevOps
- Win-loss analysis (definition, how to conduct and benefits) - Indeed
- Win Rate: what it is and how to calculate it | Klipfolio
FAQ
How do you calculate win rate?
Divide the number of closed-won deals by the total number of opportunities, then multiply by 100 for a count-based figure. For deal sizes that vary widely, use the value-based formula instead: divide the won deal value by the total opportunity value.
Is a 40% win rate good?
It depends entirely on your denominator, deal size and sales motion. A typical qualified B2B win rate sits between 20% and 35%, so 40% is strong if it’s measured against qualified opportunities consistently over time, not against a loosely defined pipeline.
What is a good win rate percentage?
There is no single correct answer; context sets it. Deal size, industry and sales motion all shift the benchmark range, which is why your own trailing trend matters more than any external number.
Can deterministic scoring improve how I report win rate?
Yes, when it ties scores directly to CRM fields you can inspect deal by deal. Commitcontrol builds its scoring this way specifically so forecast numbers stay auditable rather than dependent on a model nobody can question in the room.
Recommended
Editorial content. All metrics are Salesforce-derived and reviewed for accuracy. Not a substitute for professional judgment.
See the same discipline applied to your pipeline.
CommitControl derives every figure from your own Salesforce data. Nothing is invented, and every number traces back to the record it came from. Connect Salesforce and the same view runs live on your data within 24 hours.
Evaluate CommitControl