Top-down forecasting starts with a market-wide number and works down to a revenue target, using a market size figure multiplied by an assumed share of that market. It suits annual plans and board-level communications because it produces a defensible strategic number fast. Its weak point is near-term precision: it will not tell you which deals close this quarter. Use it to set the target, then validate that target against a bottom-up pipeline view before you commit it to a board deck.
TL;DR:
- Accurate top-down forecasts depend on current TAM figures, realistic SAM and SOM cuts, and conservative market-share assumptions, especially avoiding outdated or optimistic data.
- Scenario analysis with different market-share percentages helps account for uncertainty and emphasizes the importance of stress-testing input assumptions.
- Reconciling top-down and bottom-up forecasts regularly reveals pipeline gaps or overestimations, guiding realistic quota setting and pipeline development.
- Applying deterministic scoring with traceable deal signals improves forecast transparency and trustworthiness during board reviews.
- A well-documented assumption log, sensitivity analysis, and regular variance tracking are essential for defending the top-down forecast in executive meetings.
Table of Contents
- What is top-down forecasting: TAM, SAM, SOM and the formula
- Step-by-step: building a top-down forecast you can defend
- Worked numeric example: from TAM to revenue with scenarios
- Top-down vs bottom-up: when to use each and how they complement one another
- When to use top-down forecasting: use cases and limits
- Common pitfalls and reconciling top-down with pipeline reality
- Implementation checklist for FP&A and RevOps
- Deterministic forecasting: how traceable scores reduce forecast debate
- What a VP Sales or CRO should demand before accepting a top-down number
- Commitcontrol: making your top-down target defensible in the boardroom
- Sources
- FAQ
What is top-down forecasting: TAM, SAM, SOM and the formula
The formula behind top-down forecasting is simple: forecasted revenue equals market size multiplied by an assumed market-share percentage. Most FP&A teams break the market size figure into three layers before applying that assumption.
- TAM (Total Addressable Market): the total revenue opportunity if you captured every possible buyer. A cyber security vendor selling to European mid-market firms might size TAM at every company in that region with a security budget.
- SAM (Serviceable Addressable Market): the slice of TAM you can realistically reach given your product, geography and channel. Drop the TAM to firms your sales team can actually sell into this year.
- SOM (Serviceable Obtainable Market): the portion of SAM you can win given your current capacity, brand and competitive position.
Apply a market-share assumption to SOM, and you have the top-down forecast: revenue = market size × market share. The inputs typically come from industry analyst reports, market research firms, or your own historical revenue growth rate extrapolated forward.
FP&A’s job here is not arithmetic. It is interrogating whether the TAM figure is current, whether the SAM cut reflects real go-to-market constraints, and whether the share assumption is grounded in anything more than optimism. A stale TAM sourced from a three-year-old analyst report will quietly distort every number that follows it.
Step-by-step: building a top-down forecast you can defend
A defensible top-down number is built, not guessed. Follow a fixed sequence and document each step as you go.
- Choose your anchor. Pick TAM, last year’s revenue, or a board-set growth target as the starting figure.
- Segment down to SAM and SOM. Cut the anchor by geography, product fit and go-to-market reach until you have a realistic obtainable market.
- Set market-share assumptions and run scenarios. Build base, upside and downside cases, each with a distinct share percentage.
- Translate into quotas and territories. Push the aggregate number down into segment-level targets that sales leadership can actually own.
- Document sources and sensitivity ranges. Record where every input came from and how much the output moves if that input is wrong.
Pro Tip: *Keep a one-page assumption log alongside the model itself, not buried in a spreadsheet tab.
Step five matters more than most finance teams treat it. A number without a visible source is a number nobody can defend under questioning, and boards ask pointed questions precisely when the stakes are highest. Skipping the sensitivity range is the most common shortcut, and it is the one that causes the most damage later, because it hides how fragile the forecast actually is.
Worked numeric example: from TAM to revenue with scenarios
Take a mid-market software vendor selling contract management tools across Europe. An industry report puts the TAM for contract management software at $2 billion. The vendor’s SAM, restricted to companies with 200 to 2,000 employees in markets where it has a direct sales presence, comes to $400 million.
From that SAM, the team builds three SOM scenarios:
- Base case: 3% market share of SAM results in a forecast revenue reflecting a realistic moderate case.
- Upside case: 4.5% market share represents a more optimistic forecast scenario.
- Downside case: 2% market share reflects a conservative forecast.
The average contract value and customer counts implied by these cases help set recruitment and marketing pipeline goals but are illustrative rather than precise figures.
The market-share assumption drives more of the swing than the TAM figure itself. Move the market-share assumption by the same relative amount and the swing is nearly identical in dollar terms, but far easier to get wrong, because share assumptions are usually a guess dressed up as a number. That is the input worth stress-testing hardest before it reaches a board slide.
Top-down vs bottom-up: when to use each and how they complement one another
Top-down and bottom-up forecasting answer different questions, and treating them as competing methods misses the point. Top-down suits annual and multi-year strategic planning: it is fast, it works from limited data, and it produces a number a board can act on before the detailed pipeline even exists. Bottom-up, built rep by rep and deal by deal from CRM data, suits the one to two quarter horizon where near-term precision actually matters.
Bottom-up tends to offer better near-term accuracy because it is grounded in actual deals with actual close dates, not market assumptions. Top-down cannot see that a key account just delayed a renewal. Bottom-up can.
FP&A’s role is to present both numbers side by side, not to pick a favourite:
- State the top-down target and the bottom-up pipeline-derived number in the same report.
- Explain the gap between them in plain terms, not as a footnote.
- Treat a small gap as confirmation the plan is on track.
- Treat a wide gap as a signal to investigate pipeline coverage, capacity, or the market-share assumption itself.
When the gap is wide, the fix is not to average the two numbers. It is to work out which input is wrong: an overstated market-share assumption, or an under-resourced sales team that cannot generate enough qualified pipeline to hit the top-down target regardless of market size.
When to use top-down forecasting: use cases and limits
Top-down forecasting earns its place in a specific set of jobs, and it fails outside them.
It works well for:
- Annual operating plans and multi-year strategic targets.
- Investor decks and board reporting, where a clean, defensible headline number matters more than granular precision.
- Early-stage market sizing, before a company has enough historical data for bottom-up modelling.
- Headcount and territory planning at the start of a fiscal year.
It does not work for weekly pipeline staffing or immediate capacity decisions. A market-share assumption will not tell you whether this Tuesday’s forecast call needs three more reps on the phone.
Watch for signals that the top-down inputs have drifted: a TAM figure older than 18 months, a market-share assumption that has not moved in three planning cycles despite competitive change, or a forecast that consistently outpaces what the pipeline can support. Once you have a defensible top-down number, translate it into operational KPIs gradually, quarter by quarter, rather than dropping the full annual figure onto sales leadership as a single quota with no phasing.
Common pitfalls and reconciling top-down with pipeline reality
The same mistakes recur across most top-down models, and they are avoidable once you know to look for them.
- Optimistic market-share assumptions. A share figure that was never benchmarked against actual competitive win rates tends to drift upward with each planning cycle, because nobody wants to be the one presenting a smaller number.
- Stale TAM data. Markets move faster than annual analyst refresh cycles. Using a TAM figure that predates a major competitor entry or product shift will overstate opportunity.
- Ignoring capacity constraints. A market may be $400 million large, but if your sales team can only physically work 40 accounts this quarter, the market size is irrelevant to what you can actually close.
Reconciliation is a process, not a one-off exercise. Run both forecasts every planning cycle, quantify the gap in dollar and percentage terms, and convert that gap directly into a pipeline generation target for marketing and sales development.
Pro Tip: *Apply a deterministic haircut to individual rep forecasts based on each rep’s own historical over-forecast rate.
Governance closes the loop: keep an assumption log, require sign-off on which scenario the organisation is planning against, and track variance monthly so the next cycle’s assumptions are calibrated against what actually happened, not what was hoped for.
Implementation checklist for FP&A and RevOps
A defensible top-down plan needs process as much as it needs arithmetic. Work through this sequence each planning cycle:
- Version every assumption. Date-stamp the TAM source, the SAM cut logic and the market-share figure, and keep prior versions for comparison.
- Set pipeline coverage requirements per scenario. Define what pipeline multiple the base, upside and downside cases each require to be credible.
- Assign a reconciliation cadence and owner. Decide who compares top-down and bottom-up numbers, and how often, before the gap becomes a surprise in a board meeting.
- Run sensitivity tests before publishing. Show how the forecast moves if TAM shifts by 10% or market share shifts by one percentage point.
- Publish a short board appendix. One page, sources cited, ranges shown. Nobody in the room should have to ask where a number came from.
Deterministic forecasting: how traceable scores reduce forecast debate
A top-down target is only as credible as the proof behind it. That is where deterministic scoring earns its place alongside top-down and bottom-up methods.
Deterministic scoring means the same inputs always produce the same score, and every signal traces back to a specific Salesforce event: a stage change, a stalled activity, an owner update. There is no black-box model producing a number nobody in the room can explain. That matters because black-box dependence reduces stakeholder trust, while CRM-traceable scoring increases it.
The practical benefit for a top-down plan:
- Every deal score can be explained line by line during a board review, not defended on faith.
- Variance narratives get shorter, because the evidence trail already shows why a number moved.
- A human owns the final call on any deal, using the deterministic score as evidence, not as a verdict handed down by an algorithm.
Paired with a top-down target, deterministic scoring becomes the proof: it shows whether the pipeline underneath the target can actually support it.
What a VP Sales or CRO should demand before accepting a top-down number
A board forecast called $1.2 million. The quarter landed at $1.7 million. Nobody could explain the gap, because nobody had logged the assumptions behind either number. Deals had slipped stages quietly for weeks, and reps had padded commits to avoid an uncomfortable conversation.
Before accepting a top-down target, demand the assumption log, the TAM source, and the pipeline coverage required to hit each scenario. Ask finance three questions: where did the market-share number come from, what happens if it is wrong by two points, and does the bottom-up pipeline actually support this number today?
— Brian
Commitcontrol: making your top-down target defensible in the boardroom
Commitcontrol is the deterministic alternative to black-box scoring for sales teams already running on Salesforce. It does not replace your top-down plan. It supports better forecast defence.
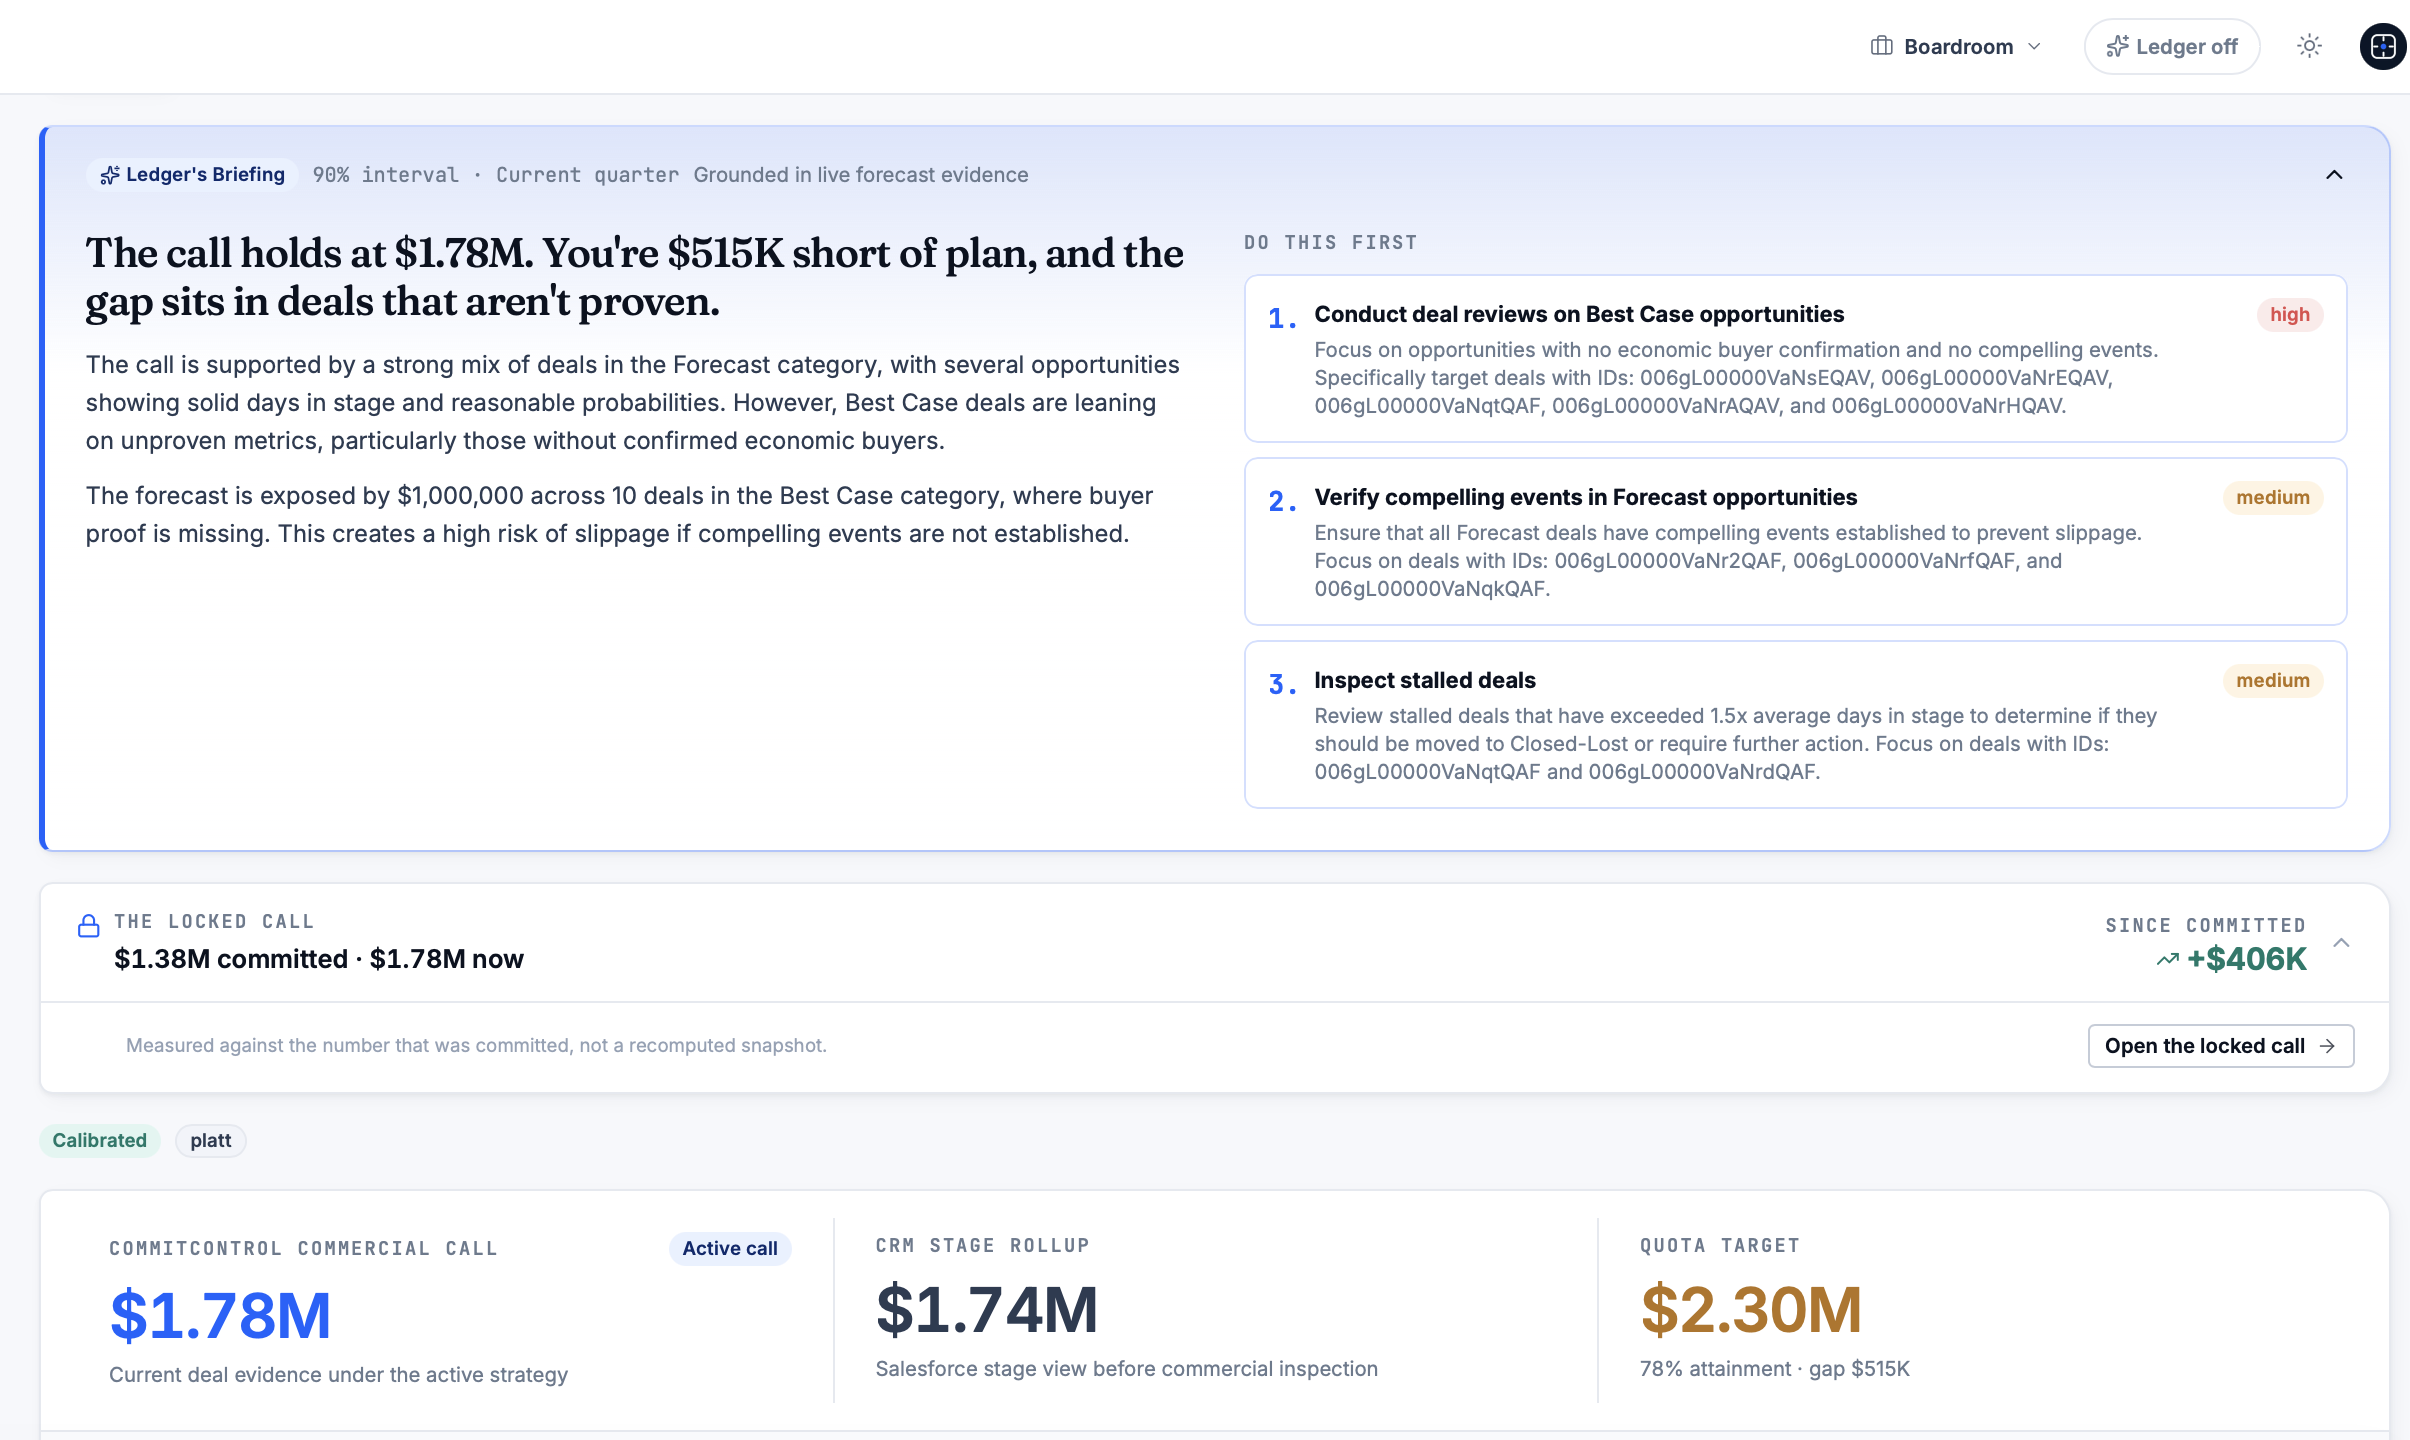
For a VP Sales or CRO who has watched a forecast miss by half a million dollars with no clear explanation, three things matter. First, every score is auditable: the same pipeline data always produces the same result, and every input traces back to a Salesforce field, not a hidden model. Second, scoring stays consistent across reps and regions, so a board comparing two territories is comparing like with like. Third, board prep gets faster, because the variance story is already written into the evidence trail rather than assembled the night before the meeting.
If your team is navigating a leadership change, the sales leadership transition page walks through how to reset a forecast without losing the board’s confidence. If you want to see what a persistent forecast miss is actually costing you, run the numbers through the forecast miss ROI calculator. Either way, book a walkthrough at Commitcontrol and bring your last board deck.
Sources
For deeper detail on method and formula, see the Corporate Finance Institute’s overview, Wall Street Prep’s formula breakdown, Gartner’s forecasting confidence research, and the forecasting textbook chapter on top-down disaggregation.
- Top-Down Forecasting - Overview, Example, Steps
- Top Down Forecasting | Formula + Calculator
- Gartner press release on sales forecasting confidence
FAQ
What is top-down and bottom-up forecasting?
Top-down forecasting starts from a market-wide figure and applies a share assumption to reach revenue. Bottom-up builds the forecast from individual deals and reps upward, using CRM pipeline data.
What is the top-down approach in forecasting?
The top-down approach takes a high-level number, typically total addressable market, and multiplies it by an assumed market-share percentage to produce a revenue target for planning and board reporting.
What are the four types of forecasting?
Common categories include top-down, bottom-up, qualitative (expert judgement or market research) and time-series or trend-based forecasting, which projects historical patterns forward.
How accurate is top-down forecasting compared with bottom-up?
Top-down tends to be less accurate for near-term forecasting because it relies on market assumptions rather than actual deal data, which is why most FP&A teams run both and reconcile the gap each cycle.
Recommended
Editorial content. All metrics are Salesforce-derived and reviewed for accuracy. Not a substitute for professional judgment.
See the same discipline applied to your pipeline.
CommitControl derives every figure from your own Salesforce data. Nothing is invented, and every number traces back to the record it came from. Connect Salesforce and the same view runs live on your data within 24 hours.
Evaluate CommitControl