Sales velocity measures how fast qualified deals turn into revenue: multiply the number of qualified opportunities, average deal value, and win rate, then divide by sales cycle length in days. The output is revenue per day, a figure that rises when reps close more, bigger, or faster deals. Salesforce and HubSpot both treat it as a core pipeline health metric.
TL;DR:
- Benchmark sales velocity within the same segment and adjust targets whenever your average deal size changes significantly.
- Focus on improving sales cycle length first, as process fixes can show measurable results within a single reporting cycle.
- Ensure pipeline data quality by removing stale opportunities and using traceable scoring for more accurate forecasting.
- Calculate sales velocity weekly for early warning signals and track trends, not just quarterly, to catch issues before forecasts are missed.
- Chart only segment-level and rep-level velocity to better identify specific bottlenecks and opportunities for acceleration.
Table of Contents
- The sales velocity formula, broken down variable by variable
- How to calculate sales velocity step by step
- A worked example of the sales velocity calculation
- Interpreting your sales velocity number and setting benchmarks
- How to improve sales velocity across each variable
- Measuring and reporting sales velocity on an ongoing basis
- Why traceable scoring matters for velocity-based forecasting
- What to do with this number next week
- A more defensible way to run your forecast
- Sources
- FAQ
The sales velocity formula, broken down variable by variable
Get the formula right and the maths is simple: (Number of qualified opportunities × Average deal value × Win rate) ÷ Length of sales cycle. Get the inputs wrong, and the number becomes noise dressed up as insight. Most disputes about sales velocity in a forecast review aren’t about the formula itself. They’re about what counts as “qualified” or where a sales cycle actually starts. HubSpot’s guidance on the calculation confirms the formula, but the counting rules are where teams diverge.
Here’s how to map each variable to your CRM without ambiguity:
- Number of qualified opportunities: count only deals that have passed a defined SQL gate, not every lead sitting in a “New” stage. Set one qualification rule and apply it identically across segments.
- Average deal value: use Annual Contract Value for subscription deals, not Monthly Recurring Revenue, unless every deal in the set uses the same billing unit. Mixing ACV and MRR in one average produces a number nobody can defend.
- Win rate: closed-won deals divided by total closed deals (won plus lost) in the period. Strip out duplicate records and redistributed opportunities before you run the calculation, or the denominator inflates and the rate looks worse than reality.
- Sales cycle length: measure from the date an opportunity is created (or hits SQL, if you’re stricter) to close date. Salesforce’s own field data supports this, and its sales velocity explainer recommends anchoring both events to stage-change timestamps rather than manually logged dates, which reps forget to update.
How to calculate sales velocity step by step
Before you touch the formula, decide two things: your time unit and your segment. Days give you an early warning signal; months or quarters suit board reporting. Never mix the two in the same table.
- Pick the segment (SMB, mid-market, enterprise) and the reporting window.
- Filter opportunities in Salesforce for the SQL stage or later, excluding disqualified and duplicate records.
- Pull closed-won deal values for the period and calculate the average. Decide upfront whether expansion revenue counts as a new deal or gets excluded.
- Calculate win rate using closed-won divided by all closed opportunities, won and lost, for that segment.
- Calculate average sales cycle length from creation to close, then remove statistical outliers. A single 400-day enterprise deal will distort a 30-day SMB cycle average.
- Run the formula and convert the daily figure into monthly or quarterly revenue for stakeholder reporting.
Pro Tip: Run the calculation on a rolling 90-day window rather than a single static quarter. It smooths out seasonal noise while still catching drift early enough to act on it.
A worked example of the sales velocity calculation
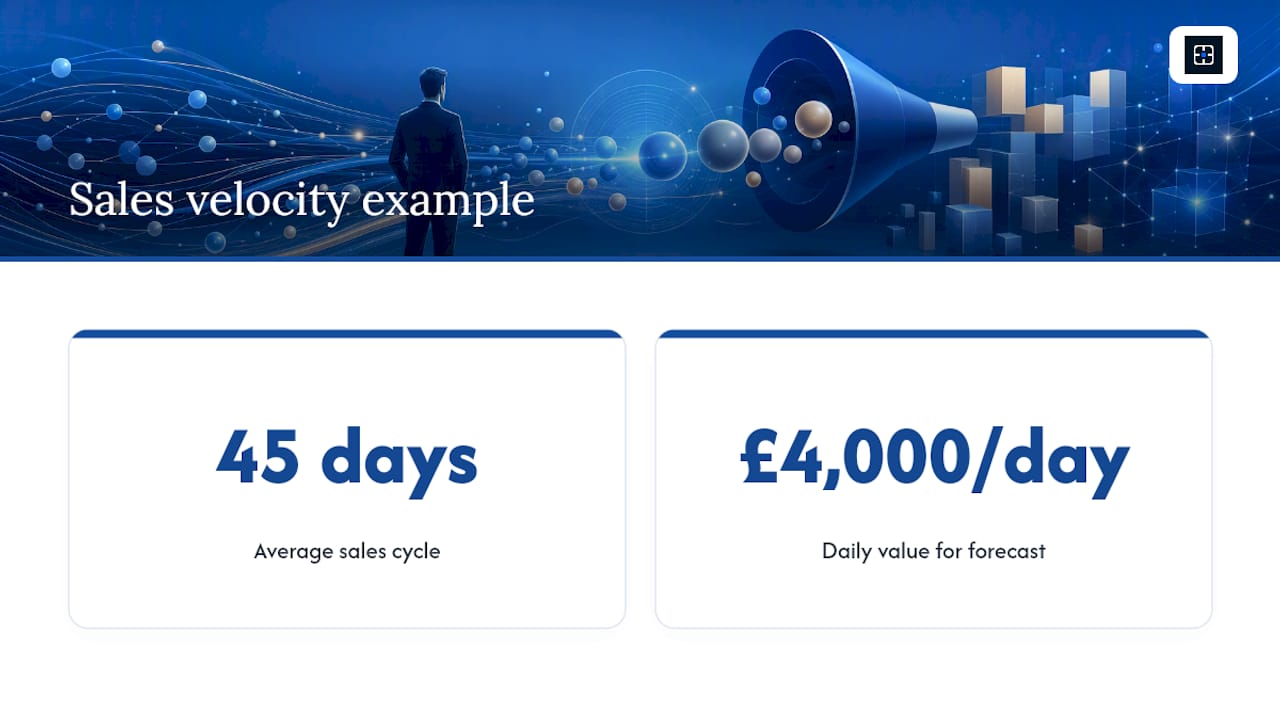
The average sales cycle runs 45 days.
That £4,000 a day is the number you take into a forecast conversation. Multiplied out, as Monday show, it becomes a monthly or quarterly figure finance can actually plan against.
Interpreting your sales velocity number and setting benchmarks
There’s no single “good” sales velocity number. A £4,000 daily figure means something completely different for a company selling £2,000 SMB contracts than one closing £200,000 enterprise deals. Benchmarking across segments without adjusting for deal size just produces a misleading average.
A 5% lift in win rate and a 5% lift in average deal size don’t produce equal results. Because deal value and win rate multiply together in the numerator, gains compound rather than add, which is why sensitivity analysis on the formula tends to favour testing several small levers over betting everything on one.
Keep these caveats in mind before you set a target:
- Compare velocity within a segment (SMB, mid-market, enterprise), never across them.
- Treat published industry benchmarks as directional. Dispersion within a single industry is often wider than the gap between industries.
- Recalculate benchmarks whenever your average deal size shifts materially, since the same win rate can look very different at a new price point.
How to improve sales velocity across each variable
Not every lever moves the number at the same speed. Some changes show up in weeks; others take a quarter to prove out. Test the fast ones first.
- More qualified opportunities: tighten your ideal customer profile so BDRs stop chasing poor-fit leads, then add capacity once qualification quality is proven, not before.
- Higher average deal value: package add-ons into the initial proposal rather than upselling after close, and anchor pricing high in the first quote so negotiation moves down, not up.
- Better win rate: standardise a qualification checklist (BANT, MEDDIC, or your own variant) and run a weekly deal review on anything past proposal stage.
- Shorter sales cycle: automate meeting scheduling, template proposals so legal and pricing approval doesn’t sit in someone’s inbox for a week, and set internal SLAs for response time between stages.
Pro Tip: If you can only test one lever this quarter, start with cycle length. It’s the easiest variable to influence with process fixes alone, and improvements show up in the metric within a single reporting cycle. Tightening rep response time, the same principle behind structured lead follow-up cadences, often shortens the early stages of a cycle before a deal ever reaches proposal.
Measuring and reporting sales velocity on an ongoing basis
Calculate velocity weekly for internal signal, monthly for trend reporting, and quarterly for the board. Zendesk’s guidance on sales performance metrics is blunt about this: the four inputs move fast enough that a quarterly-only calculation hides problems until they’ve already cost you a forecast.
Build your dashboard around a few essentials:
- Velocity by segment, not a single blended company-wide number.
- Rep-level trend lines, so you catch a slipping cycle length before it shows up in the aggregate.
- Pipeline quality filters that flag stale opportunities sitting untouched for more than 14 days.
- A weekly stage-progression audit, checking that deals are actually advancing rather than being re-dated to look current.
Feed the resulting number directly into forecast conversations. A velocity figure that’s dropping quarter over quarter is an earlier warning than a missed number at quarter close.
Why traceable scoring matters for velocity-based forecasting
Sales velocity tells you the pipeline is moving. It doesn’t tell you whether the deals inside it are real. That gap is where most forecasts fall apart: a rep marks a deal “commit,” the stage changes, and three weeks later it slips with no clear reason anyone can point to.
The forecast isn’t wrong because the formula is bad. It’s wrong because nobody can explain which inputs changed, when, or why. A commit number that can’t be traced back to specific CRM signals isn’t a forecast. It’s a guess with a decimal point.
Commitcontrol builds deterministic scoring directly on Salesforce data, so the same inputs always produce gives the same score and every signal behind it is traceable back to the record that generated it. That matters most in a board review, where “the model said so” doesn’t hold up but “here’s the exact field that changed” does. Cleaner pipeline data, fewer padded commits, and a decision a human can actually own follow from that transparency, not from a more complex prediction.
What to do with this number next week
Run segment-level velocity this week and brief your forecast owner on it, not just the topline. Fix one data-quality issue (likely stale opportunities) and test one lever, such as shortening demo-to-proposal time. Use the resulting figure to set one clear, defensible target for next quarter.
— Brian
A more defensible way to run your forecast
Most forecasting tools promise accuracy through a model nobody outside the vendor can inspect. Commitcontrol takes the opposite approach: the same inputs always produce gives the same score, and every one of those inputs traces back to a Salesforce field you can point to in a board meeting. That’s a meaningful difference from black-box scoring that changes its own logic between quarters, and it’s the reason revenue leaders use it to defend commits rather than just report them.
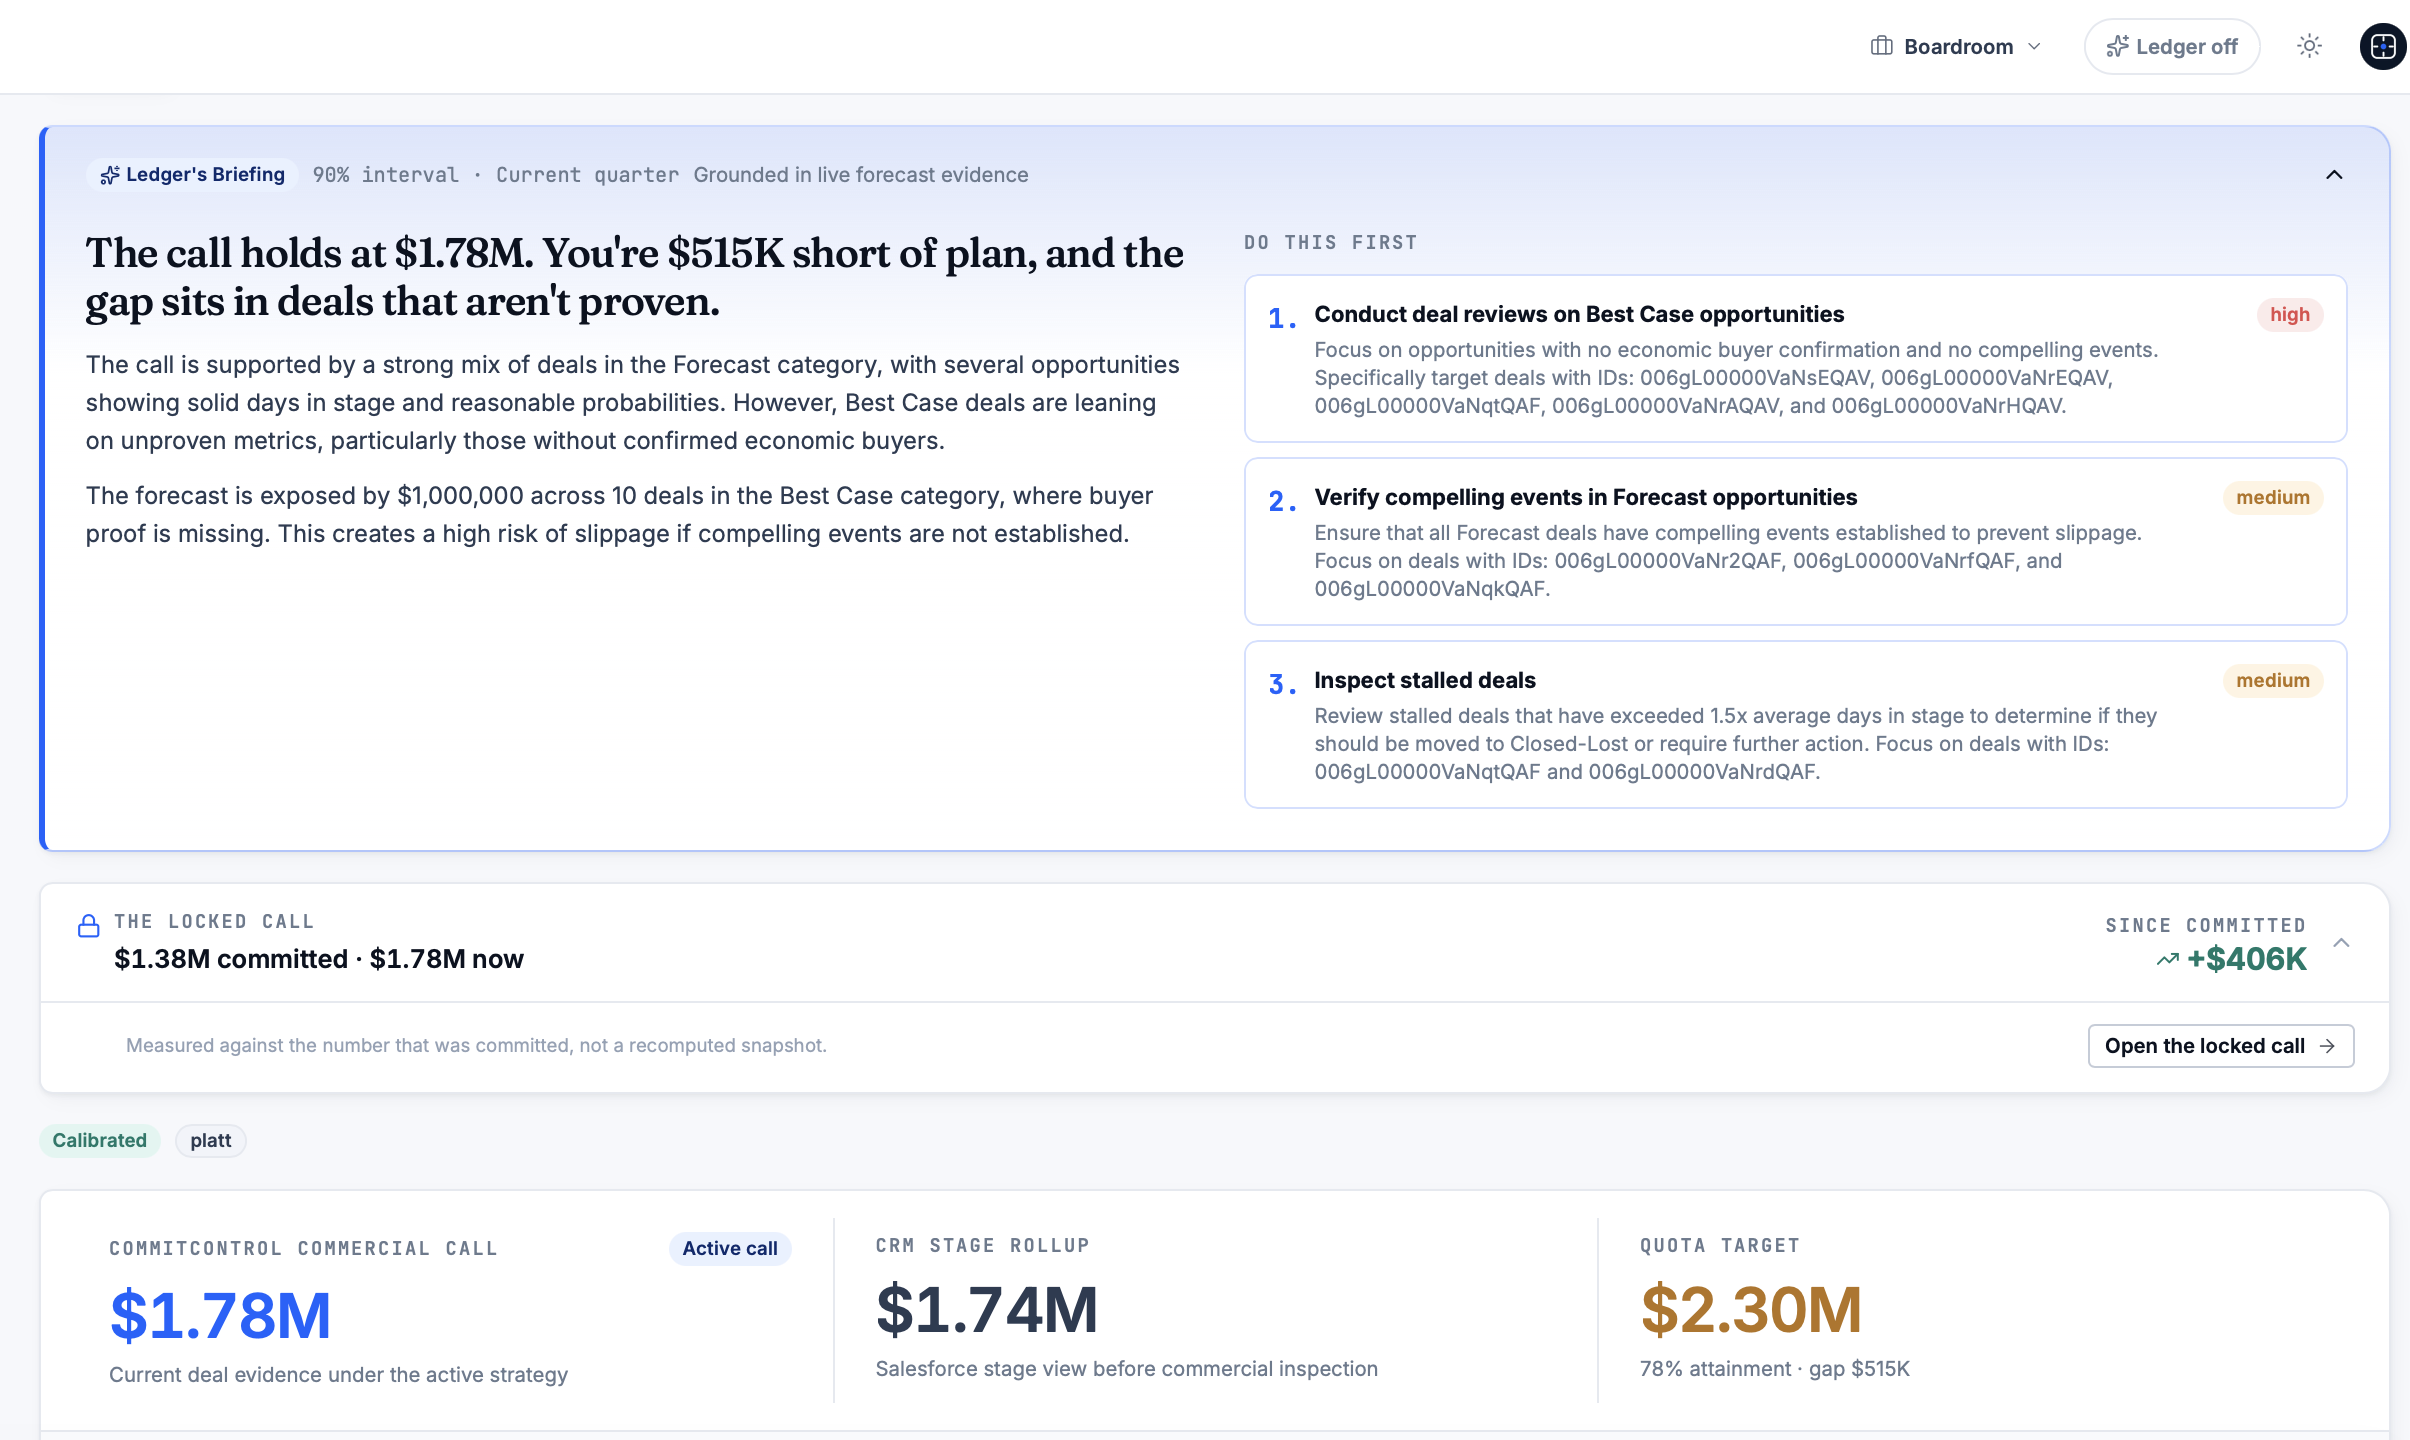
If you want to see what a forecast miss is actually costing you before you change anything, run the numbers through the Sales Forecast Miss ROI Calculator. If you’re closer to ready, book a walkthrough of how deterministic scoring plugs into your existing Salesforce setup at Commitcontrol.
Sources
For verifying your own calculation or benchmarking against wider guidance:
- Sales Velocity: What It Is & How to Measure It
- What Is Sales Velocity? | Salesforce
- Sales performance metrics and sales velocity guidance
- What Is Sales Velocity? Definition, Formula, And Examples
FAQ
What is a good sales velocity number?
There’s no universal benchmark. A “good” number depends entirely on your deal size and segment, so compare your velocity against your own historical trend within the same segment rather than an industry-wide figure.
What is the 10-3-1 rule in sales?
It’s a rough sales prospecting ratio suggesting you need several leads to generate a few qualified conversations and one closed deal. Definitions of the exact ratio vary by source and industry, so treat it as a rule of thumb rather than a fixed standard.
What does sales velocity mean?
It means how quickly your pipeline converts qualified opportunities into closed revenue, expressed as revenue per day, month, or quarter. A rising number means deals are moving faster, getting bigger, closing more often, or some combination of the three.
What is the formula to calculate sales velocity?
Sales velocity equals the number of qualified opportunities multiplied by average deal value multiplied by win rate, divided by the length of the sales cycle. The result is expressed as revenue generated per unit of time, typically per day.
How often should you calculate sales velocity?
Calculate it weekly for internal tracking and monthly for trend and board reporting, since the four input variables can shift quickly enough to hide problems if measured only once a quarter.
Recommended
Editorial content. All metrics are Salesforce-derived and reviewed for accuracy. Not a substitute for professional judgment.
See the same discipline applied to your pipeline.
CommitControl derives every figure from your own Salesforce data. Nothing is invented, and every number traces back to the record it came from. Connect Salesforce and the same view runs live on your data within 24 hours.
Evaluate CommitControl