Seven metrics decide most weekly sales reviews: pipeline coverage ratio, commit vs best vs called, forecast accuracy by rep, win rate, quota attainment, meetings booked, and stage conversion rate. Each one has a formula, a benchmark, and a specific corrective action attached to it. If a metric on your dashboard cannot trigger a decision, it does not belong in the weekly review. It belongs in a monthly report instead.
TL;DR:
- A pipeline coverage ratio below 2.5x often signals an urgent need for pipeline generation to prevent quarter-end shortfalls.
- Forecast accuracy should be tracked by individual reps against previous quarters to detect consistent padding and improve reliability.
- Dashboard design must place leading indicators above lagging results, with automated CRM integration ensuring real-time, reliable data.
- Red flags such as a forecast variance over 10% or stage conversion drops of more than 15 points require immediate review and targeted coaching.
- Using deterministic scoring built from your own Salesforce history enhances forecast transparency and defensibility in executive discussions.
Table of Contents
- Core sales metrics to track by category
- How should you design a VP sales dashboard?
- How do you operationalise sales metrics for accountability?
- What are realistic sales metric benchmarks and red flags?
- Why does data quality determine whether metrics can be trusted?
- Why does deterministic scoring change how much you can trust a forecast?
- What does better metrics discipline actually change in practice?
- How do you integrate sales metrics with your CRM for automated reporting?
- What common pitfalls distort sales metrics and forecasts?
- What I’d fix first if I inherited a broken forecast
- How Commitcontrol turns these metrics into a defensible forecast
- Sources
- FAQ
Core sales metrics to track by category
Every metric below earns its place because it changes a decision, not because it looks good on a slide. Group them by category and the whole reporting structure becomes obvious: leading indicators tell you what’s coming, lagging indicators tell you what happened, and forecast metrics tell you whether your commit can be trusted.
Pipeline metrics
- Pipeline coverage ratio: total open pipeline value ÷ quota. A 3x ratio means £3 of pipeline for every £1 of target. This is the single number that predicts a miss before it happens.
- Pipeline velocity: (number of opportunities × average deal value × win rate) ÷ sales cycle length in days. This tells you how fast revenue is actually moving through the funnel, not just how much is sitting in it, according to Improvado’s dashboard guide.
- Stage conversion rate: opportunities that advance from one stage to the next, divided by opportunities that entered that stage. A stalled conversion rate at one stage usually means a qualification problem, not a closing problem.
- Deal slippage: the percentage of deals whose close date moves at least once. High slippage almost always means deals were logged too early, not that the market shifted.
Activity metrics
Dials, emails, and connect rates set the floor for pipeline creation. Reasonable daily targets vary by role and product complexity, but the pattern that matters is the ratio, not the raw count: connect rate (connected calls ÷ dials attempted), meetings booked per week, and follow-up rate (leads contacted within 24 hours ÷ leads assigned). A rep who dials twice as much as a peer but converts at half the rate has an execution problem, not an effort problem.
Revenue metrics
- Win rate: closed-won opportunities ÷ total closed opportunities (won plus lost). Track it by segment and by rep, because a blended win rate hides which reps or which deal sizes are dragging the average down.
- Average deal size: total revenue closed ÷ number of deals closed. Watch the trend line, not the snapshot.
- ACV/ARR: annual contract value and annual recurring revenue remain the cleanest way to compare deals of different lengths and payment structures.
- Quota attainment: revenue closed ÷ quota assigned, segmented by rep, team, and tenure. A team hitting 100% in aggregate while half the reps sit under 70% is not a healthy team.
Engagement metrics
Email reply rate, demo-to-close rate, and content engagement (video watch time, proposal opens) predict opportunity creation earlier than pipeline value does. HubSpot’s metrics catalogue treats these as the earliest warning signals available before a deal even enters a formal stage, per HubSpot’s guide to sales metrics.
Forecast metrics
This is where most forecasting breaks down. Track three numbers side by side: commit (what the rep guarantees), the best case (what the rep believes is possible), and called (what leadership actually reports upward). Then measure forecast accuracy: |actual revenue − forecast| ÷ forecast × 100. A forecast landing close to actual is workable. Wide swings quarter to quarter mean the commit process lacks rigor.
Forecast accuracy has to be tracked by rep, not just by team, because a single overconfident rep can distort an otherwise reliable team number. Tracking it against prior quarters, rather than just the current one, is how you catch a rep who pads every cycle in the same direction.
How should you design a VP sales dashboard?
Place leading indicators directly above the lagging outcome they predict. Pipeline coverage sits above closed revenue. Meetings booked sits above pipeline created. This physical arrangement is deliberate: visual proximity between cause and effect is what lets a VP diagnose a miss in seconds rather than in a follow-up meeting, according to Improvado’s dashboard design research.
Match the visual type to the metric, not to what looks impressive:
- Line charts for trends over time (pipeline growth, forecast accuracy by quarter)
- Gauge or bullet charts for anything measured against a fixed target (quota attainment, coverage ratio)
- Funnel charts for stage conversion, so a bottleneck stage is visible at a glance
- Waterfall charts for forecast variance, showing exactly which deals moved the number between snapshots
A compact dashboard built around roughly a dozen metrics across pipeline, activity, forecast, and revenue tends to outperform a sprawling one, because a VP can actually hold twelve numbers in their head during a live review, according to Fairview’s VP dashboard framework.
Refresh cadence and alerts
Statistic Callout: Recommended refresh cadence differs sharply by metric type. Activity data should update in real time. Pipeline and forecast metrics are best reviewed weekly, since more frequent updates create noise without changing the decision, per Improvado’s guidance.
Set alert thresholds that actually fire before the quarter is lost, not after: pipeline coverage dropping below 2.5x, forecast variance exceeding 10% between weekly snapshots, or a rep’s commit shrinking two weeks in a row. A weekly VP review built around this layout should open with forecast accuracy and coverage, move to stage conversion for any team below plan, and close with a decision: reforecast, generate pipeline, or leave it alone.
How do you operationalise sales metrics for accountability?
A metric without an owner is a chart nobody argues with. Assign ownership before you assign targets:
- SDRs own meetings booked and outreach volume, reviewed daily against a simple pass/fail bar.
- AEs own pipeline velocity and demo-to-close rate, reviewed weekly with their manager.
- Sales managers own quota attainment and new-rep ramp time, reviewed weekly in 1:1s focused on coaching, not just reporting.
- The VP owns pipeline coverage ratio and forecast accuracy across the whole team, reviewed weekly with authority to reforecast.
Cadence should match the volatility of the metric. Activity dashboards get checked daily because they change daily. Pipeline and quota numbers get a weekly cut because daily noise there just wastes everyone’s attention. Outsales’ reporting framework makes the same case: route every report to a named owner and pair a leading metric with a lagging one so the meeting produces a decision, not just a status update.
Decision triggers turn a review from a status meeting into a working session:
- Pipeline coverage falls below 2.5x quota: launch immediate pipeline generation, don’t wait for month end.
- Forecast variance exceeds 10% against the prior snapshot: require the rep to re-commit and walk through the root cause deal by deal.
- Stage conversion at one stage drops more than 15 points below its trailing average: pull that stage for a targeted coaching session, not a general pipeline review.
Pro Tip: If a metric moving up or down would not change what you do next week, drop it from the weekly deck. Move it to a monthly report instead. A crowded dashboard is usually a sign leadership hasn’t decided what actually matters yet.
What are realistic sales metric benchmarks and red flags?
Benchmarks vary by segment, deal size, and sales cycle, but a few ranges hold up across most mid-market B2B teams and are worth anchoring your reviews to.
| Metric | Typical healthy range | Red flag | Suggested action |
|---|---|---|---|
| Pipeline coverage ratio | Multiple times quota | Too low | Immediate pipeline generation push |
| Win rate (consultative mid-market) | Typical healthy range | Persistently low | Deal review and qualification audit |
| Forecast accuracy | Within a narrow range of actual | Higher variance over time | Root-cause review and rep re-commit |
| Sales cycle length | Varies by segment; track trend, not absolute number | Lengthening significantly quarter over quarter | Stage-by-stage bottleneck review |
| Connect rate (calls) | Varies by channel and list quality; track trend | Sharp week-over-week drop | Audit list quality and dialling cadence |
Forecast accuracy deserves the closest attention because it is the metric boards actually hold leaders to. Track it against prior quarters as well as the current one. When a red flag appears, the action needs to be specific: a reforecast conversation is not the same fix as a pipeline generation sprint, and applying the wrong one wastes a quarter you don’t get back.
Why does data quality determine whether metrics can be trusted?
A metric is only as good as the field it’s calculated from, and most forecasting failures trace back to inconsistent definitions rather than bad luck. Outsales’ research on reporting reliability makes this point directly: reporting collapses when teams don’t agree on what a number actually measures.
Fix the definitions first, before touching the dashboard:
- Agree, in writing, on what counts as a “qualified opportunity”, what “close date” means, and how deal value is entered when there’s a multi-year or usage-based component.
- Automate capture wherever possible. Optional free-text fields are where ambiguity creeps in, because two reps will fill the same field two different ways.
- Require a named owner to sign off on every commit number before it rolls up. A commit with no signature attached is a guess with a decimal point.
- Track push rate: how often a deal’s close date moves, and by how many days on average. A rep who pushes the same deal three times in a quarter is telling you something the pipeline value alone won’t show.
An audit trail on every commit change does more than tidy up your CRM. It’s the only thing that stops a padded commit or a stale close date from quietly distorting the number leadership reports to the board.
Why does deterministic scoring change how much you can trust a forecast?
Most forecasting tools score deals with models that adjust themselves as they ingest more data. That’s useful for pattern-matching across large datasets, but it creates a specific problem in a board meeting: you can’t always explain why a score changed, and the same deal can score differently next week for reasons that aren’t traceable back to anything a rep did.
Deterministic scoring works differently. The logic is fixed. It’s built entirely from your own Salesforce history, not calibrated against other companies’ data, so the same inputs always produce the same score. Every number can be taken apart, field by field, and defended in the room. That matters most in the exact moment forecast accuracy matters most: when a CFO asks why the number changed since last week, and “the model recalibrated” is not an answer anyone accepts twice.
Commitcontrol builds its scoring this way. The benefits are practical, not theoretical:
- Forecast accuracy tracked by rep, so a systemic pad shows up before it reaches the board number.
- A readable evidence trail behind every score, tied directly to Salesforce data with no separate rep workflow to maintain.
- A number you can defend, deal by deal, in a forecast meeting without falling back on “the system flagged it.”
If you want to see how the scoring logic applies to your own pipeline, the pricing page outlines the plans, and the product overview walks through how the audit trail works end to end.
What does better metrics discipline actually change in practice?
The pattern shows up consistently across teams that tighten their metric set: forecast misses shrink once a team stops reviewing forty metrics and starts reviewing seven that actually trigger action. A pipeline coverage ratio that drops below 2.5x and gets acted on immediately, rather than noticed at month end, is the difference between a manageable shortfall and a quarter that unravels in the final two weeks.
The pattern that shows up again and again is not more data. It’s fewer, better-owned numbers reviewed on a fixed cadence with a named owner attached to each one. Teams that move from ad hoc pipeline reviews to a structured weekly cadence, built around coverage, forecast accuracy, and stage conversion, typically catch a slipping quarter with enough runway left to actually fix it: a pipeline generation sprint, a targeted coaching push, or a reforecast that reflects reality instead of hope.
The common thread in every recovery story is timing. A red flag caught in week three of the quarter is a correction. The same red flag caught in week eleven is a post mortem. The metrics don’t change. What changes is whether anyone was watching the right seven numbers closely enough to act in time.
How do you integrate sales metrics with your CRM for automated reporting?
Manual spreadsheet reporting is where most metric programmes quietly die. If a rep or manager has to re-enter numbers into a separate tracker, the data will drift from the CRM within a quarter, and nobody will notice until the two numbers disagree in a board meeting.
Build reporting directly on top of Salesforce (or your CRM of record) rather than beside it. HubSpot’s own reporting suite includes replicable templates, such as lead funnel reports, meeting outcome tracking, and pipeline waterfall views, that most CRMs can reproduce natively, according to HubSpot’s sales analytics documentation. The principle holds regardless of which CRM you run: automate the capture, and let the dashboard pull live from the same fields reps already update as part of their normal workflow.
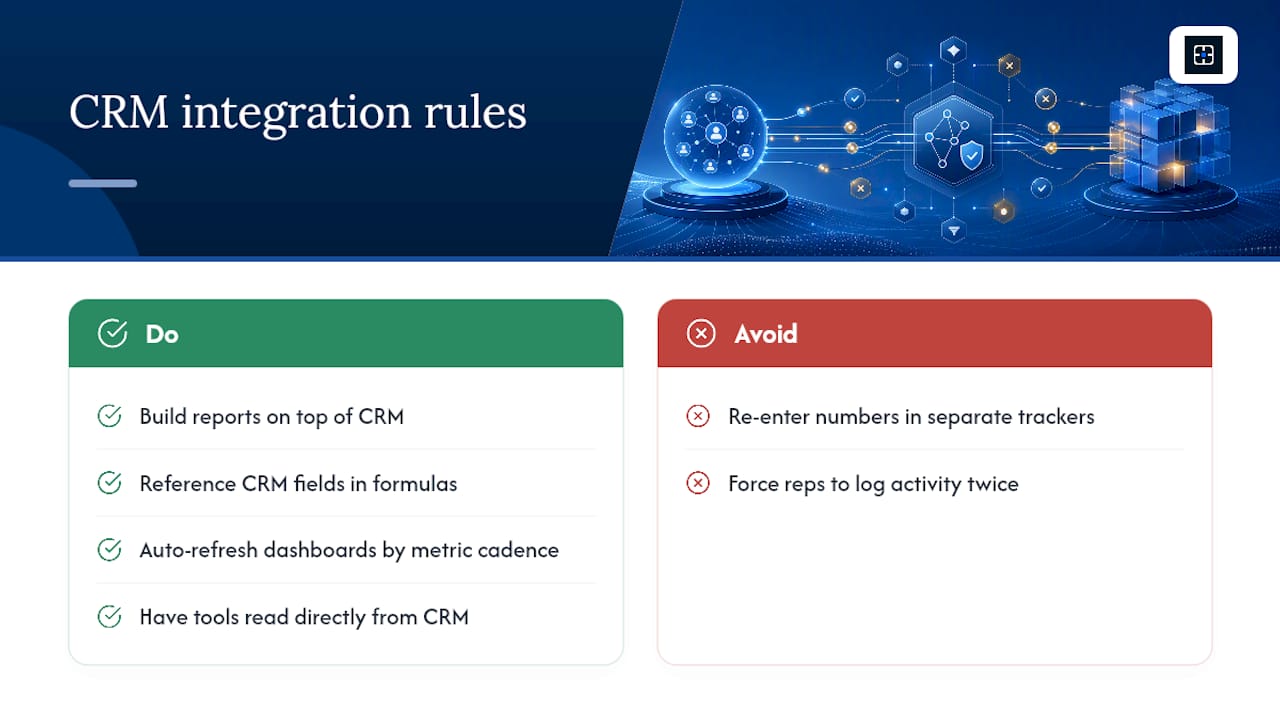
Three integration rules keep this from breaking down. First, every metric formula should reference a CRM field, not a manually maintained figure that lives in someone’s spreadsheet. Second, dashboards should refresh automatically at the cadence each metric needs, not whenever someone remembers to export a report. Third, any tool layered on top of the CRM, whether that’s a forecasting platform or a reporting add-on, should read directly from Salesforce data rather than requiring reps to log activity twice. The moment reps maintain two systems, one of them becomes unreliable.
What common pitfalls distort sales metrics and forecasts?
Vanity metrics are the most common trap. Total pipeline value, activity volume, and lead counts all feel productive to report, but none of them predict revenue on their own. A pipeline worth £10 million means nothing if £6 million of it has sat in the same stage for four months with no next step logged.
Padded commits are the second, and more damaging, pattern. A rep under pressure will round a “maybe” deal up to a commit because missing target two quarters running feels worse than a one time correction. This is exactly why forecast accuracy needs to be tracked by rep and against prior quarters: a rep who pads consistently will show a repeatable variance pattern, even if any single quarter looks defensible on its own.
Stale close dates compound both problems. A deal that’s been pushed three times but still counts toward this quarter’s coverage ratio is inflating a number that leadership is about to report upward. The fix isn’t more scrutiny at forecast time. It’s structural: require a reason code every time a close date moves, track push count as its own metric, and treat a deal pushed more than twice as a flag for manager review rather than a routine pipeline update. None of this requires new technology. It requires deciding, in advance, that a number without an audit trail doesn’t get reported as fact.

What I’d fix first if I inherited a broken forecast
Every forecasting failure I’ve seen traces back to the same root cause: too many metrics, no owner, and a commit number nobody could defend under questioning. The one metric I always watch first is forecast accuracy by rep, tracked against the prior two quarters, because it exposes padding faster than any pipeline review ever will.
If you do nothing else this quarter, do this: cut your dashboard down to the metrics that trigger a decision, and require a named owner to sign off on every commit before it rolls up. Everything else is reporting. This is operating.
— Brian
How Commitcontrol turns these metrics into a defensible forecast
Most vendors score deals with models that recalibrate behind the scenes, which is exactly why forecast reviews so often end in an argument nobody can settle. Commitcontrol takes a different route: deterministic, fully auditable scoring built from your own Salesforce history. The logic is fixed. The same inputs always produce the same score, and every number can be traced back to the field that produced it.
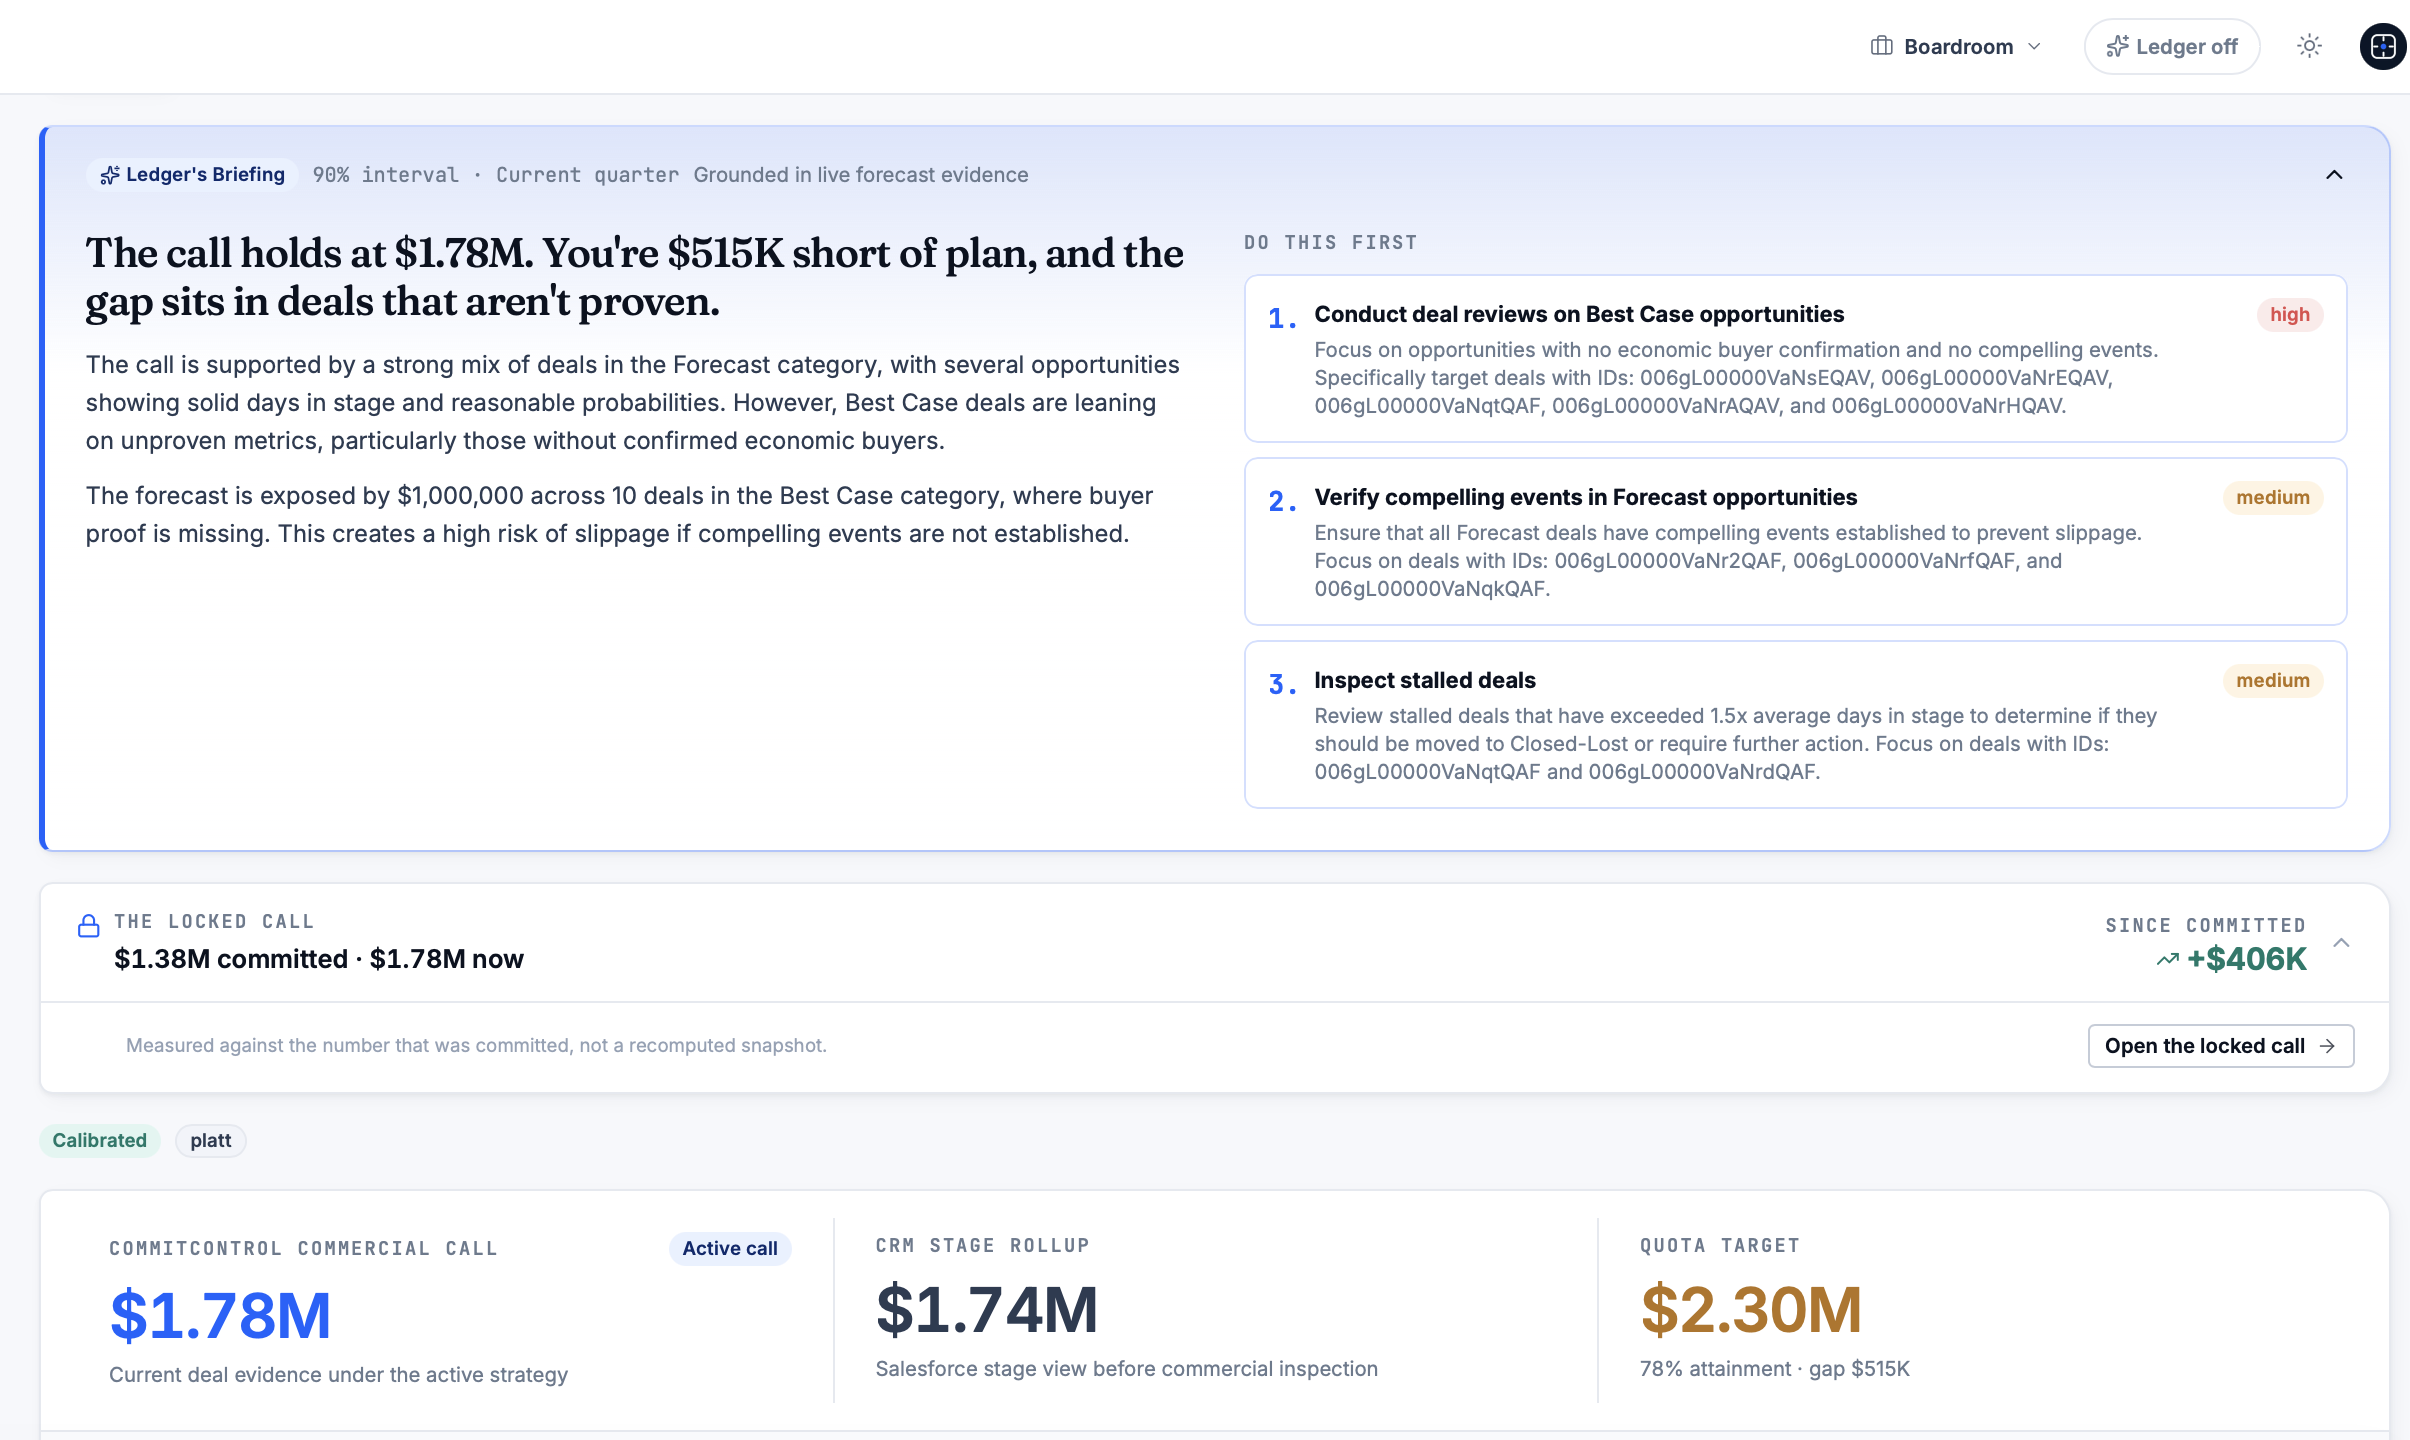
That matters most in the meeting where it counts. When a board member asks why the commit dropped from last week, you need an answer built from your own data, not a black-box explanation. Commitcontrol’s audit trail gives you that: forecast accuracy tracked by rep, deal-by-deal reasoning behind every score, and no change to how your reps already work in Salesforce.
Plans run from Insight at €249 per month up to Executive at €1,999 per month, with Enterprise available on request, and every plan covers the whole team rather than charging per seat. If you want to see what a forecast miss is actually costing you, run the numbers through the forecast miss ROI calculator or book a walkthrough to see the audit trail against your own pipeline.
Sources
- Sales Dashboard Guide: Metrics, Benchmarks & Design (2026)
- The VP Sales dashboard: 14 metrics that drive results
- Sales Reporting: Definition, Key Reports & Best Practices | Outsales
- Sales metrics to track: HubSpot blog
FAQ
What are the top sales KPIs to track?
The top five are pipeline coverage ratio, win rate, forecast accuracy, quota attainment, and sales cycle length. Each has a clear formula and a benchmark range, and each one should trigger a specific action when it drifts, as covered in the core metrics section above.
What are the most important metrics to track for sales performance?
Beyond the top five, activity metrics like meetings booked and connect rate, plus engagement metrics like demo-to-close rate, give the earliest warning that pipeline creation is slowing. Forecast accuracy tracked by rep is the metric that catches padded commits before they reach the board.
What is the 30-60-90 rule in sales?
Ramp time is a structured onboarding plan for new reps or leaders, breaking their first quarter into phases: learning the product and territory, running early pipeline activity, and hitting independent quota contribution. It’s a ramp framework, not a forecasting metric, though ramp time itself is worth tracking as part of quota attainment by tenure.
What are the five pillars of sales performance?
Definitions vary by source, but a common version groups performance into pipeline generation, conversion (win rate and stage progression), deal size, sales cycle efficiency, and forecast accuracy. These map directly onto the categories covered above: pipeline, activity, revenue, engagement, and forecast.
How often should sales metrics be reviewed?
Activity metrics need real-time or daily visibility, pipeline and forecast metrics work best on a weekly cadence, and quota attainment is typically reviewed weekly with a monthly rollup, according to dashboard refresh guidance from Improvado. Reviewing forecast metrics more often than weekly usually adds noise rather than insight.
How much does Commitcontrol cost?
Commitcontrol’s plans start at Insight for €249 per month, with Command at €899 per month and Executive at €1,999 per month, all listed on the pricing page. Enterprise pricing is available on request, and every plan covers the full team rather than billing per seat.
Recommended
Editorial content. All metrics are Salesforce-derived and reviewed for accuracy. Not a substitute for professional judgment.
See the same discipline applied to your pipeline.
CommitControl derives every figure from your own Salesforce data. Nothing is invented, and every number traces back to the record it came from. Connect Salesforce and the same view runs live on your data within 24 hours.
Evaluate CommitControl