Sales capacity is what your team can realistically produce given headcount, ramp and attrition. Quota is what you assign each rep to hit, with pay attached. Treat them as the same number and your plan breaks the first time someone quits mid-quarter. The fix is to build capacity-adjusted quotas: size the team’s true output first, then divide fairly, using earlier hiring, better conversion or higher per-rep quotas to close whatever gap remains.
TL;DR:
- Capacity calculations should always be based on ramp-adjusted rep equivalents, not raw headcount, to avoid overestimating team output.
- Reconciliation between quota-based and funnel-based capacity methods confirms model accuracy when results are within 10 to 15 percent.
- Adjustments for vacancy drag and segment-specific ramp rates are essential for realistic capacity modeling, especially during hiring fluctuations.
- Quotas must be set from capacity estimates, not arbitrary targets, and include buffers for overachievement and churn to remain sustainable.
- Building transparent, data-driven capacity models improves forecast trustworthiness and eases defending quotas during leadership reviews.
Table of Contents
- Sales capacity vs quota: definitions and where each belongs
- How to calculate sales capacity: two formulas and a worked example
- Model inputs that change the answer: ramp, attrition and territory
- Turning capacity into quota: ratios, buffers and sign-off
- Where capacity models go wrong, and what to fix immediately
- Why deterministic inputs matter more than another dashboard
- Tools and templates to build your own capacity model
- A publisher’s take on why the model matters more than the tool
- Sources
- FAQ
Sales capacity vs quota: definitions and where each belongs
A board sets a revenue target. RevOps turns that target into sales capacity: the total revenue your current and planned headcount can realistically produce once ramp, attrition and average attainment are factored in. Sales leadership then turns capacity into quota: what an individual rep is expected to deliver, tied to commission and performance reviews.
The distinction matters because the two numbers answer different questions. Capacity answers “can we physically produce this?” Quota answers “who owns which slice of it, and what happens if they miss?” Confuse the two and you get a common failure pattern: a CFO wants £10 million, there are 20 reps, so quota becomes £500,000 each. Nobody checked whether 20 reps, several of them mid ramp, several others new hires who haven’t closed a deal yet, can actually produce £10 million. That’s how a forecast called at $1.2 million lands at $1.7 million, or the reverse: reps pad their commits because the number was never grounded in what the team could do.
Use this checklist to decide which lever to pull:
- Revisit quota when a rep’s territory, patch size or role changes, or when attainment data over two consecutive quarters shows the number was set wrong.
- Revisit capacity assumptions when headcount plans slip, attrition spikes, or ramp is taking longer than modelled.
- Revisit both at the start of each planning cycle, before the board number gets divided by headcount.
Capacity planning must account for ramp, attrition, quota and average attainment together, not the target in isolation.
How to calculate sales capacity: two formulas and a worked example
There are two credible ways to calculate capacity, and they should roughly agree. If they don’t, something in your model is wrong.
- Quota-based method. Capacity = Quota per rep × Expected attainment % × Number of ramped-rep equivalents. This method starts from what each rep is assigned and discounts for the fact that nobody hits 100% every quarter.
- Funnel-based method. Capacity = Qualified opportunities × Win rate × Average contract value. This method starts from pipeline mechanics and works forward to revenue, independent of what quota says a rep “should” produce.
Both are legitimate; a quota-based method and a funnel-based method are complementary views of the same team, and one is a check on the other.
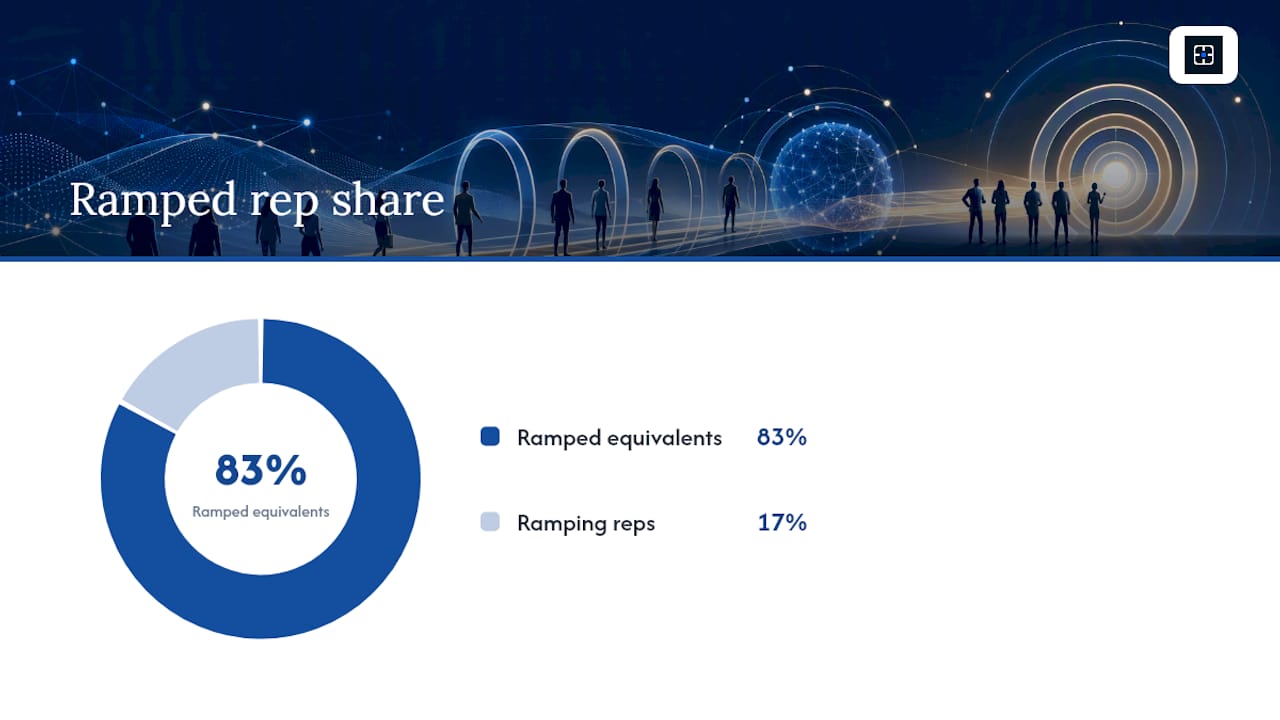
Worked example. Say you run 10 account executives. That gives you roughly 8.3 ramped-rep equivalents, not 10. Average quota is £400,000 per rep, per quarter.
Quota-based capacity: 8.3 × £400,000 × 0.85 = a capacity in the £2.8 million range for the quarter.
Now run the funnel-based check. Marketing and outbound combined generate 240 qualified opportunities this quarter. Average contract value is £52,000. That calculation produces close to the quota-based figure.
Reconciliation check: when the two methods land within roughly 10 to 15% of each other, your capacity model is sound. A wider gap usually means one side is wrong, either quota assignments are aspirational and disconnected from pipeline reality, or your funnel assumptions (win rate, ACV) are stale. A large gap between the two views is the clearest early signal that quota was set from hope rather than capacity.
Reconciling both views before you present a number to the board is the single highest-leverage step in this entire process. It’s also the step most teams skip because it takes an extra afternoon in a spreadsheet.
Model inputs that change the answer: ramp, attrition and territory
The formulas above are only as good as their inputs. Four adjustments separate a defensible model from a hopeful one.
Ramp curves. Convert your roster into ramped-rep equivalents rather than counting warm bodies. A rep hired in week two of the quarter is not a full head for planning purposes.
Attrition and vacancy drag. Every open seat costs you the time it sits empty plus the ramp time of whoever fills it. If a rep leaves in month one of a quarter and the replacement starts in month two, you’ve lost roughly four to five months of full productivity from that seat, not one.
- Model vacancy drag explicitly: (months vacant + ramp months for the replacement) as a fraction of the seat’s full productive period.
- Never use raw headcount as a stand in for capacity; ramp-adjusted rep equivalents are the only honest input.
- Segment your assumptions: enterprise reps ramp slower and carry longer sales cycles than SMB reps, and blending them into one average hides real risk.
- Check territory potential bottom up: accounts in patch × outbound or inbound open rate × win rate × average contract value should roughly match the top-down quota you’re about to assign.
Pro Tip: Build a separate ramp and attrition tab for each segment (enterprise, mid-market, SMB) rather than one blended average. Blended models routinely overstate enterprise capacity and understate SMB capacity, because the two motions ramp and attrite at completely different rates.
Counting ramped-rep equivalents rather than raw headcount avoids the inflated capacity numbers that mid-year hiring waves tend to create on a spreadsheet nobody stress-tested.
Turning capacity into quota: ratios, buffers and sign-off
Once capacity is grounded, quota setting becomes arithmetic rather than guesswork.
- Start from attainment-adjusted productivity. Divide your capacity figure by ramped-rep equivalents to get a realistic per-rep number, then set individual quotas around that baseline, adjusted for territory strength and experience. Working from an assumed 100% attainment instead disguises how much hiring you actually need.
- Check the quota:OTE ratio. A common healthy range sits between four and six times on-target earnings. If quota is set far above that ratio, reps see the number as unreachable and disengage early; far below it, and comp becomes too generous relative to what’s being asked.
- Build in deliberate overassignment. Most well-run teams assign roughly 10 to 20% more in total quota than raw capacity suggests, to account for reps who overachieve, unbudgeted upside pipeline and the fact that not every seat stays filled all year. This is not padding; it’s a buffer for the seats you know will churn.
- Run the sign-off checklist before the board sees a number. Test each rep’s patch against realistic account coverage. Test pipeline coverage (aim for three to four times quota in qualified pipeline entering the quarter). Stress-test hire timing: if your Q3 plan assumes two new hires ramped by August, what happens to capacity if they start in September instead?
Building quota bottom up from capacity, rather than top down from a board target, is what makes the number survivable when someone asks how you got there.
Where capacity models go wrong, and what to fix immediately
Five mistakes account for most of the unrealistic quotas that leadership has to walk back mid-year:
- Dividing the board target by headcount instead of ramped-rep equivalents.
- Ignoring vacancy drag when a hiring plan slips by even one quarter.
- Using one blended assumption set across segments with very different sales cycles.
- Assuming 100% attainment as the baseline instead of the team’s actual historical average.
- Setting quota and then never checking it against the funnel based view.
A healthy quota structure usually shows 55 to 65% of reps at or above 100% attainment, with the median rep landing close to 90%. If your distribution shows most reps stuck at 60 to 70%, quota was set from the target down, not from capacity up, and that’s usually caused by headcount substituted for ramp-adjusted capacity somewhere in the model.
When the gap surfaces, present it plainly on one slide: current capacity, target, the shortfall, and the three levers available (earlier hiring, conversion improvement, or redistributing quota). Pick one lever per quarter and revisit.
Why deterministic inputs matter more than another dashboard
Most forecast misses aren’t a modelling problem. They’re a trust problem. A rep pads a commit because the number attached to their name feels unreachable, and nobody upstream can trace why. The forecast called $1.2 million and landed $1.7 million not because the market was better than expected, but because the quota was never tied to real capacity in the first place, and the commit process had no way to catch it.
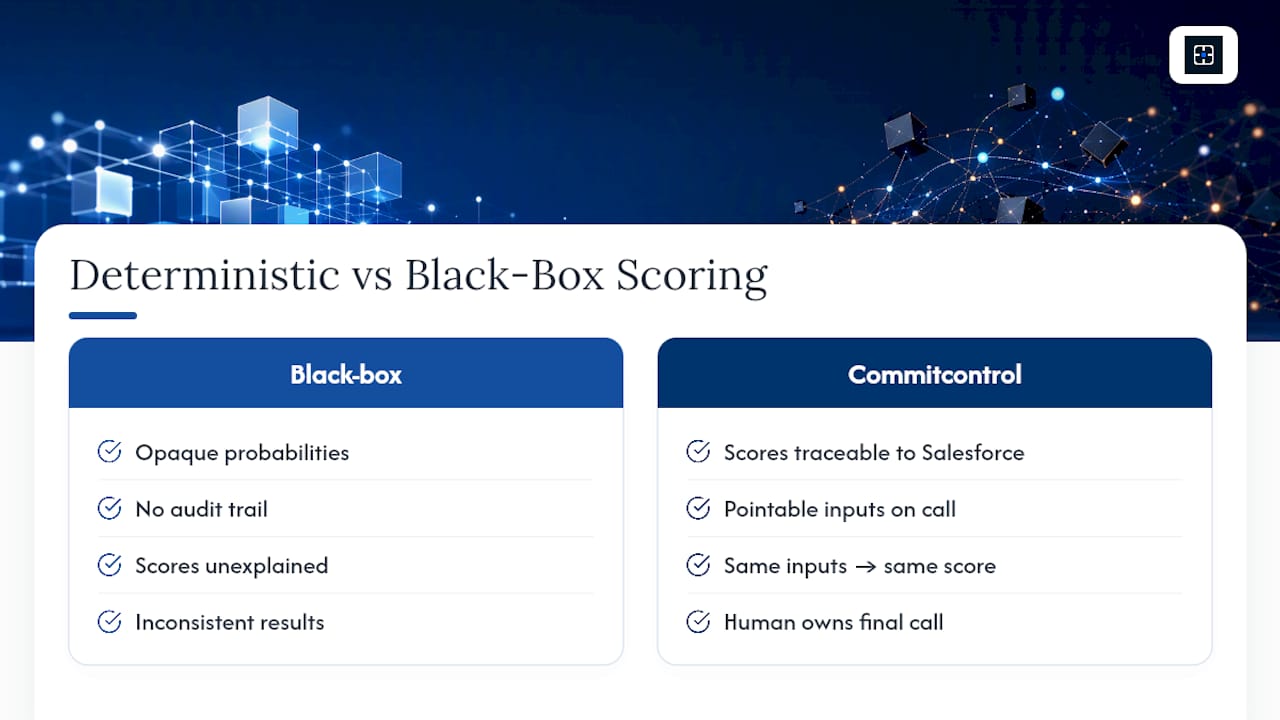
Most vendors solve this with black box scoring: a probability appears, and nobody in the room can explain why it moved. Commitcontrol takes a different route. Every score traces back to Salesforce data you can point to on the call. Same inputs, same score, every time, with a human still owning the final call. That’s what makes a number defensible in a board meeting, not just plausible.
If you want to quantify what a forecast miss actually costs your business, Commitcontrol’s ROI calculator walks through the maths. If capacity gaps are surfacing because of a leadership change, the sales leadership transition guide covers how to reset the forecast without losing a quarter.
Tools and templates to build your own capacity model
Salesforce’s own guide on sales capacity planning covers the core formula and ramp-adjustment logic. QuotaPath’s step-by-step model guide includes a worked spreadsheet for both the quota-based and funnel-based methods. Ziellab’s capacity-first quota guide sets out the quota:OTE and attainment-distribution benchmarks used above. For verifying the numbers you feed into a board deck against live Salesforce data, Commitcontrol’s pricing page outlines plans built for that exact use case.
A publisher’s take on why the model matters more than the tool
The capacity model above isn’t complicated. Most RevOps leaders could build it in an afternoon. The reason so few teams actually run it is that once you’ve built it, you’re on the hook for defending it, and defending a number in front of a board is uncomfortable when you can’t trace where it came from.
That’s the real argument for deterministic scoring over probabilistic black boxes. A capacity model built from Salesforce data, with fixed formulas and no hidden calibration, gives you the same answer every time you run it. When a CFO asks why quota looks the way it does, you can walk through the ramp curve, the attrition assumption and the funnel check, line by line. Enterprise tools that output a single probability score without showing the reasoning behind it put you in a worse position: you have a number, but not an explanation.
Commitcontrol was built for exactly that gap between a forecast and the reasoning behind it. It won’t build your capacity model for you. But once you have one, it will help you defend the commit that follows.
— Brian
Sources
- Sales capacity planning - Salesforce blog
- Build a Sales Capacity Model (Step-by-Step) - QuotaPath
- Sales quota setting: start from capacity, not hope - Ziellab
- Sales capacity planning: the complete guide - RevenueTools
FAQ
What does “sales capacity” mean?
Sales capacity is the total revenue your current sales team can realistically produce, once you account for ramp time, attrition and average historical attainment. It answers what the team can physically deliver, distinct from what any individual rep is assigned to hit.
What does a quota mean in sales?
A quota is the specific revenue or activity target assigned to an individual rep, usually tied to commission and performance review. It should be derived from capacity rather than set independently from a board target.
Is 90% sales quota good?
A rep or team attaining roughly 90% of quota generally sits close to a healthy median; well built quota structures see 55 to 65% of reps at or above 100% attainment with the middle of the pack landing near 90%. If most of the team is stuck around 60 to 70%, quota was likely set too high relative to actual capacity.
What is the difference between a sales quota and a sales target?
A sales target is usually the top-line revenue goal set by the board or leadership for the whole company or team. A sales quota is that target broken down and assigned to an individual rep, and it should be built bottom up from capacity rather than divided evenly by headcount.
Recommended
Editorial content. All metrics are Salesforce-derived and reviewed for accuracy. Not a substitute for professional judgment.
See the same discipline applied to your pipeline.
CommitControl derives every figure from your own Salesforce data. Nothing is invented, and every number traces back to the record it came from. Connect Salesforce and the same view runs live on your data within 24 hours.
Evaluate CommitControl