Track six numbers and you can defend a forecast in the boardroom: pipeline coverage, sales velocity, win rate, forecast accuracy, net revenue retention, and one efficiency ratio such as LTV:CAC. Together they explain whether your pipeline is healthy and whether your forecast is honest. Get the data governance behind them right and predictable revenue stops being an aspiration.
TL;DR:
- Pipeline coverage should be maintained between 3 and 5 times the quota, but this varies based on deal quality and sales cycle length, requiring careful validation.
- Conversion rates, especially between critical stages, need to be monitored for drops, which indicate specific issues like pricing friction or lead handoff problems.
- Revenue velocity and average days in stage serve as early warnings for stalled deals or inflated pipelines, helping to prevent forecast misses.
- Forecast accuracy must be tracked using volume-weighted calculations and segmented by region or product line to identify systemic biases and improve prediction reliability.
- Building an auditable scorecard involves enforcing CRM discipline, documenting formulas, and ensuring traceability of every number to a trustworthy data source.
Table of Contents
- What are RevOps metrics, and how do you organise them?
- Which RevOps KPIs actually predict revenue, and how do you calculate them?
- How do you build one executive scorecard instead of five dashboards?
- How should you calculate and report forecast accuracy?
- How do you make RevOps metrics auditable, not just accurate?
- What should you check weekly, monthly, and at board level?
- What’s the 90-day path from messy data to a trusted scorecard?
- Why deterministic metrics win the trust that dashboards can’t
- Get RevOps metrics you can defend, not just report
- Sources
- FAQ
What are RevOps metrics, and how do you organise them?
RevOps metrics are the shared numbers that let sales, marketing, and customer success agree on one version of the truth: what’s in the pipeline, what it’s worth, and how likely it is to close. They exist to replace department-specific spreadsheets with a single, defensible set of figures that finance and the board can act on.
The mistake most teams make is treating every metric as equally important. It isn’t. Metrics fall into a hierarchy, and each layer answers a different question:
- Coverage — is there enough pipeline to hit the number?
- Conversion — is pipeline moving through stages correctly?
- Velocity — how fast does a deal move from open to closed?
- Quality — when deals close, are they the right size and do they stick?
- Efficiency — what does it cost to acquire and retain that revenue?
- Value — what’s the lifetime worth of the customers you’re winning?
This structure comes directly from Pedowitz Group’s RevOps metrics framework, which recommends organising a metrics programme around exactly these six themes rather than tracking whatever each function happens to report.
The detail that makes or breaks this: every metric needs one formula, one owner, and one definition of “closed” or “qualified” that everyone uses. Without that, coverage in the CRM won’t match coverage in the board deck, and nobody will trust either number.
Which RevOps KPIs actually predict revenue, and how do you calculate them?
Some metrics tell you about today’s pipeline. Others tell you whether tomorrow’s forecast is honest. Both matter, and mixing them up is where most scorecards go wrong.
Coverage: how much pipeline do you actually need?
Pipeline coverage is generated pipeline divided by the quota you’re trying to hit. Pedowitz Group’s benchmark puts the target at 3 to 5 times quota, but that range isn’t universal.
Owner: RevOps, in partnership with sales leadership. Action if it drops: don’t panic and inflate the pipeline with unqualified deals. Check whether marketing-sourced pipeline has slowed, or whether reps are sitting on stalled deals instead of disqualifying them.
Conversion: where does pipeline actually leak?
Stage-to-stage conversion rate is the percentage of deals that move from one stage to the next, calculated per stage, per segment, per quarter. Acceptance and qualification ratios (marketing-qualified leads accepted by sales, sales-qualified leads accepted into pipeline) sit upstream of this and catch handoff problems before they become forecast problems.
Owner: RevOps for the calculation, sales management for the remediation. Action if it drops: isolate the stage. A collapse between “demo” and “proposal” is a different problem (value articulation) than a collapse between “proposal” and “close” (pricing or procurement friction).
Velocity: how fast is the pipeline actually moving?
Sales velocity measures how quickly deals move through the pipeline and translates directly into revenue per day: number of opportunities × average deal value × win rate, divided by average sales cycle length in days. Pedowitz Group tracks this as revenue velocity, and it’s one of the fastest ways to spot leakage before it shows up in quarterly numbers.
A companion metric, average days in stage, tells you exactly where deals stall. If average days in “negotiation” creeps from 12 to 28, that’s not noise. That’s a signal reps are carrying deals they should be disqualifying, and it’s usually the earliest warning sign of a forecast that’s about to miss.
Owner: RevOps analytics, escalated to sales management when a specific stage stalls. Action if it drops: audit the stalled stage for deals with no next step logged in the CRM in the last 14 days. Those are the deals inflating your pipeline without any real chance of closing.
Quality: are the deals you win worth winning?
Win rate is deals won divided by total qualified opportunities (won plus lost), and it should be tracked by segment, not just company-wide. A blended win rate hides the fact that your enterprise segment might be converting at 15% while SMB converts at 45%.
Net revenue retention (NRR) and gross revenue retention (GRR) extend quality past the initial close. NRR includes expansion and contraction; GRR strips out expansion to show pure retention. SaaS Capital’s benchmarking data puts median NRR at roughly 103% and median GRR at roughly 91% among bootstrapped B2B SaaS companies.
Benchmark check: if your NRR sits meaningfully below 103% or your GRR trails 91%, don’t assume it’s a churn problem in isolation. SaaS Capital’s retention research shows retention correlates strongly with average contract value: higher-ACV segments post higher medians and tighter ranges. Benchmark by deal size, not company age.
Owner: RevOps for calculation, customer success leadership for the response. Action if it drops: segment by ACV band before you conclude anything. A GRR dip concentrated in your lowest-ACV tier is a different fix (self-serve onboarding, usage monitoring) than one spread evenly across the base.
Predictability: is the forecast telling the truth?
This is the category the board actually cares about, and it gets its own detailed treatment below. In short: forecast accuracy and forecast bias, reported with volume weighting rather than a flat average.
Owner: RevOps, presented jointly with the CRO.
Efficiency: what does growth actually cost?
Customer acquisition cost (CAC) is total sales and marketing spend divided by new customers acquired in the period. Lifetime value (LTV) is average revenue per customer multiplied by average customer lifespan (or, more precisely, gross margin per customer divided by churn rate). LTV:CAC ratio divides one by the other, and revenue per employee (total revenue divided by headcount) is a useful sanity check on whether growth is coming from more spend or more productivity.
Owner: Finance and RevOps jointly, since CAC touches both marketing spend and sales cost allocation. Action if it drops: don’t cut acquisition spend reflexively. Check whether CAC rose because deal cycles lengthened (a velocity problem) or because acquisition cost per channel actually increased (a spend allocation problem). Those need different fixes.
How do you build one executive scorecard instead of five dashboards?
Most RevOps teams don’t have a metrics problem. They have a proliferation problem: sales has a dashboard, marketing has a dashboard, finance has a spreadsheet, and none of the three numbers agree. The fix isn’t more reporting. It’s one scorecard.
Pedowitz Group recommends limiting the executive scorecard to six to eight metrics, one from each layer of the hierarchy above, published from a single source of truth rather than assembled fresh each month from separate exports.
Design principles:
- Six to eight metrics maximum. If a metric doesn’t change an executive decision, it doesn’t belong on this page.
- One source of truth. The scorecard pulls from the CRM directly, not from a rep’s manually updated spreadsheet.
- Every number traces back to a formula in the glossary, not to someone’s memory of how it’s usually calculated.
The glossary is what makes the scorecard defensible under questioning. For every metric it should record:
- The exact formula, written out, not described
- The data owner responsible for accuracy
- The calculation cadence (daily, weekly, monthly)
- The segment definitions used (by region, product line, or ACV band)
A simple brief layout works well here: theme, metric, owner, current value, target, and trend. Coverage sits under RevOps at 4.2× against a 4× target, trending flat. That layout alone turns a QBR from a debate about numbers into a discussion about action.
Cadence: Pedowitz Group’s governance guidance recommends weekly reviews for pipeline hygiene, monthly QBRs for trend analysis, and a distilled board-ready narrative that strips the noise down to what changed and why.
How should you calculate and report forecast accuracy?
Forecast accuracy is 1 minus the absolute value of (actual minus forecast) divided by forecast, expressed as a percentage. A forecast landing significantly above or below actual revenue indicates incorrect assumptions behind that number and should be scrutinized carefully.
The detail most teams skip: a simple average across deals hides the real story. Gartner’s peer research on forecast measurement recommends volume-weighted accuracy, where larger deals carry proportionally more weight in the calculation, because a miss on your biggest deal matters more than a miss on a small one.
Forecast bias is a separate calculation: (actual minus forecast) divided by forecast, without the absolute value. This tells you the direction of the error. Consistent positive bias means reps or managers are systematically sandbagging. Consistent negative bias means commits are being padded to look good in the moment, then quietly walked back later in the quarter.
Reporting levels: Gartner’s guidance is clear that segmented reporting beats a single company-wide number for driving action. Report volume-weighted accuracy and bias by product line, region, or sales motion to RevOps and sales leadership, where it can trigger specific fixes. Present the exec team a distilled version: total-company accuracy and bias, plus a one-line explanation of which segment drove the miss.
Common fixes:
- Persistent under-forecasting in one segment: audit whether that segment’s reps use looser stage definitions than the rest of the team.
- Persistent over-forecasting: check whether “commit” deals are being locked before a next step is confirmed with the buyer.
- Wide swings quarter to quarter: look for manual overrides in the CRM that bypass whatever scoring logic is supposed to set the number.
How do you make RevOps metrics auditable, not just accurate?
A metric that can’t be traced back to its source data isn’t a metric your CFO can defend. Gartner’s view on RevOps maturity is blunt on this point: maturity isn’t about consolidating dashboards, it’s about assigning clear ownership to cross-functional milestones and trusting the CRM data underneath every KPI.
That trust has to be earned with specific controls:
- Stage definitions written down and enforced, not left to individual rep interpretation.
- Mandatory fields at each stage transition, so a deal can’t advance without a next step and a close date.
- Close reason taxonomy that’s short and specific enough to spot patterns (“lost to competitor,” “no budget,” “no decision”) rather than a catch-all “other.”
- Next-step discipline, tracked as a field, not a note buried in an activity log.
Beyond field-level hygiene, you need lineage: a documented record of where each number in the scorecard originates, what transformations happen to it, and who signed off on any change to the formula. When someone asks why win rate moved from 30% to 26%, the answer should be a documented change to the qualification rules, not a shrug.
This is precisely the gap a deterministic scoring approach closes. Rather than a probabilistic model that produces a score without a clear explanation, a deterministic method applies fixed, published rules to CRM data, so the same inputs always produce the same score and every calculation can be inspected line by line. That auditability is what separates a number you can present and a number you can defend under cross-examination from your own board.

Pro Tip: Before your next board meeting, pick your three largest open deals and ask a colleague to reconstruct their forecast score using only what’s logged in the CRM. If they can’t, your forecast has a documentation problem, not a data problem.
What should you check weekly, monthly, and at board level?
Cadence prevents metrics fatigue and keeps the right eyes on the right numbers at the right time.
- Weekly ops check: inspect stalled deals (no next step in 14 days), missing close reasons on recently lost deals, and any pipeline coverage swing over 10% week on week. Correct data entry issues immediately; don’t let them accumulate into a monthly cleanup job.
- Monthly QBR: present stage conversion trends, win rate by segment, and velocity against the prior quarter. RevOps owns the data; sales management owns the narrative about what’s driving the trend.
- Board narrative: a headline number (forecast accuracy for the quarter), the variance cause in one sentence, the remediation already underway, and a stated confidence level for next quarter’s number. This is where NRR and coverage make their one appearance, tied directly to the growth story.
Match each layer to its audience. Reps don’t need to see NRR trends; the board doesn’t need to see individual stalled deals.
What’s the 90-day path from messy data to a trusted scorecard?
You don’t fix RevOps metrics in a single sprint, but you can get to something board-ready in one quarter if you sequence the work correctly.
- Days 1 to 30: publish the metrics glossary, assign one owner per metric, and enforce basic CRM hygiene rules (mandatory next-step fields, standard close reasons). Success looks like: every metric on your scorecard has a name attached to it.
- Days 31 to 60: instrument the fields you’re missing, backfill at least two quarters of historical data where possible, and run a lineage check on every number feeding the scorecard. Success looks like: you can trace any figure back to its raw CRM source without asking anyone a question.
- Days 61 to 90: present your first board-ready scorecard using real, traceable numbers, then revisit targets based on what the first quarter of clean data actually shows. Success looks like: the targets you set in month one get adjusted, not abandoned.
Pro Tip: Resist the urge to fix all six metrics at once in month one. Start with pipeline coverage and forecast accuracy: they expose the most CRM hygiene problems and give you the fastest credibility win with the board.
Why deterministic metrics win the trust that dashboards can’t
Most forecast tools promise accuracy and deliver a black box. You get a score, not a reason, and when the number moves you’re left guessing why. That’s the exact problem CROs describe: a forecast called at £1.2 million lands at £1.7 million, and nobody can explain the gap because nobody can explain the model.
Deterministic scoring fixes the wrong problem well: it doesn’t promise perfect prediction. It promises that the same inputs always produce the same score, and every signal traces back to something in Salesforce a human can check. That’s a lower bar than “AI predicts your revenue,” and it’s the one that actually survives a board meeting.
— Brian
Get RevOps metrics you can defend, not just report
Most teams solve the metrics problem by buying another dashboard tool, and dashboards are genuinely good at showing you a number. They’re not built to show you why that number is what it is, or to survive the moment a board member asks how a score was calculated. Some scoring tools use deterministic, auditable scoring built directly on Salesforce history, with fixed logic and an evidence trail behind every figure on the scorecard.
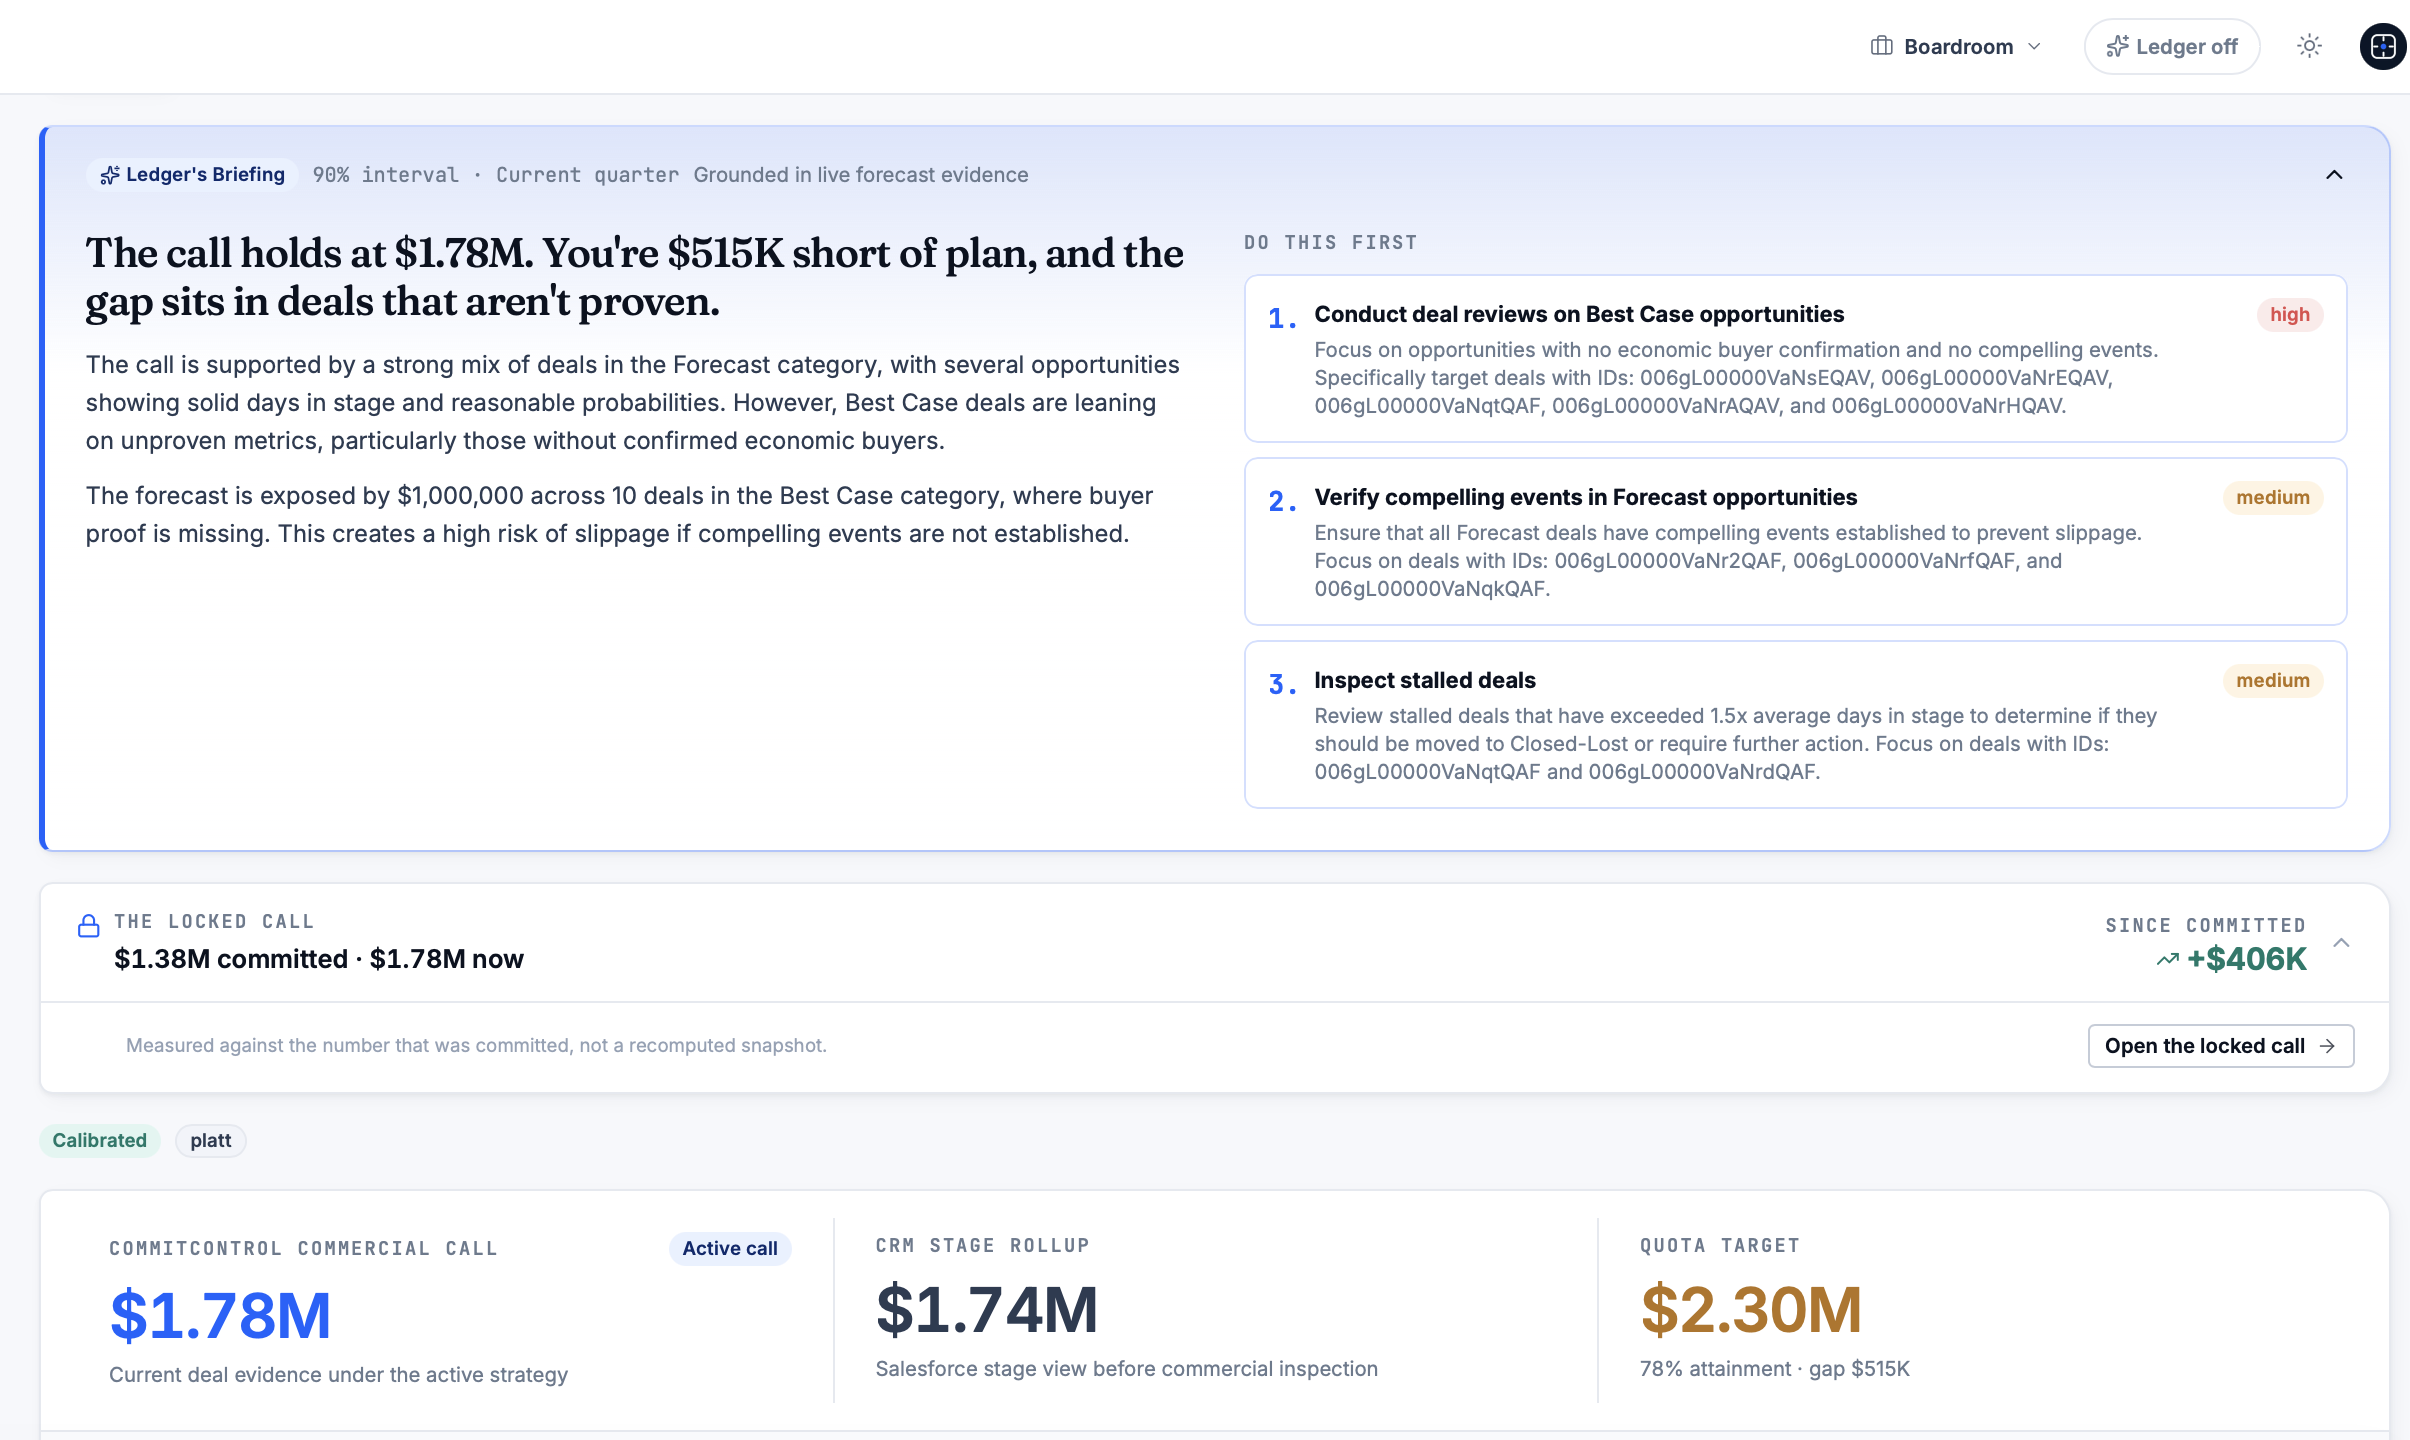
That means no calibration across other companies’ data, no unexplainable score drift, and no rep workflow to relearn. Every pipeline coverage number, every forecast accuracy figure, every win-rate trend can be inspected calculation by calculation, which is what makes it defensible in the room where forecasts actually get challenged. Data residency and handling are documented in detail on the security and GDPR page, for teams whose compliance function asks first and questions later.
Commitcontrol runs on four plans: Insight at €249 per month, Command at €899 per month, Executive at €1,999 per month, and Enterprise with pricing available on request. Every plan covers the whole team, with no per-seat charges. If you’re mid-transition on your sales leadership team, the sales leadership transition solution is built specifically for resetting a forecast under new ownership. Start by running your last quarter’s numbers through the forecast miss ROI calculator to see what an unexplained variance actually costs.
Sources
- RevOps metrics to track & report | Pedowitz Group
- 2026 Benchmarking metrics for bootstrapped SaaS companies - SaaS Capital
- Most effective way to measure forecast accuracy | Gartner Peer Community
FAQ
What are the five key performance indicators for RevOps?
Most RevOps scorecards centre on pipeline coverage, sales velocity, win rate, forecast accuracy, and net revenue retention, with an efficiency ratio like LTV:CAC often added as a sixth. Pedowitz Group’s framework recommends limiting an executive scorecard to six to eight metrics total, one drawn from each layer of the coverage, conversion, velocity, quality, efficiency and value hierarchy.
What does RevOps include?
RevOps covers the alignment of sales, marketing, and customer success around one shared set of data, processes, and metrics, rather than each function running its own reporting. It typically includes pipeline management, forecasting methodology, CRM data governance, and cross-functional metric ownership.
What is RevOps versus DevOps?
RevOps (revenue operations) aligns sales, marketing, and customer success teams around shared revenue metrics and CRM data. DevOps is a software engineering discipline focused on integrating development and IT operations to ship code faster; the two share a naming pattern but operate in entirely different functions.
What are the top three KPIs for revenue operations?
If forced to pick three, pipeline coverage, win rate, and forecast accuracy give the clearest read on whether revenue will land on target. Coverage tells you if there’s enough in the pipeline, win rate tells you how much of it converts, and forecast accuracy, measured with volume weighting per Gartner’s guidance, tells you whether the number you’re presenting is trustworthy.
How do you make RevOps metrics auditable for the board?
Auditability comes from documented stage definitions, mandatory CRM fields, a published glossary with one formula per metric, and clear lineage showing where each number originates. Deterministic scoring tools such as Commitcontrol support this by tying every score to traceable Salesforce data rather than an unexplainable model output.
Recommended
Editorial content. All metrics are Salesforce-derived and reviewed for accuracy. Not a substitute for professional judgment.
See the same discipline applied to your pipeline.
CommitControl derives every figure from your own Salesforce data. Nothing is invented, and every number traces back to the record it came from. Connect Salesforce and the same view runs live on your data within 24 hours.
Evaluate CommitControl