Revenue risk management, in a Salesforce pipeline, means identifying, scoring and managing deal-level exposure so leaders can prioritise material opportunities and prepare a defendable forecast. The immediate step is straightforward: pull the current commit, run a pipeline inspection on the largest open deals, and check where the model number and the rep’s number disagree. Record what you decide and why. That single habit, repeated weekly, turns forecast calls from guesswork into something you can defend and later review.
TL;DR:
- Regular pipeline inspections should focus on deals with no activity over 14 days, large discrepancies between model and rep commitments, and deals pushed out of the current period more than once.
- Material deals require scrutiny based on value, contribution to quota, and the percentage of total forecast they represent, with high-value, stale, or wide-gap deals flagged for review.
- Building a defendable forecast involves comparing the system-generated model number against the rep’s submit, recording adjustments with rationale at the time of decision, and reviewing these rationales periodically.
- Weekly routines include updates from reps, pre-call analysis using flagged deal lists, and a structured review call to improve forecast accuracy significantly.
- Tools like Salesforce and CommitControl support these processes by surfacing risk signals, tracking deal movement, and recording decision evidence without adding workload for sales reps.
Table of Contents
- What does inspecting pipeline data for revenue risk actually involve?
- Which deals deserve your attention before the call?
- How do you build a forecast call you can defend afterwards?
- What weekly rhythm keeps forecast prep from eating your week?
- What tools actually support the inspection and defence work?
- How do you spot a deal slipping before the rep says anything?
- How do you put a number on deal-level revenue risk?
- How do you capture what reps know that the CRM doesn’t show?
- How should you set up dashboards to surface risk, not just totals?
- Should external market data feed into your Salesforce risk view?
- How do you train reps to enter data without adding new work?
- An honest view on tools, judgement and evidence
- See what CommitControl surfaces in your own pipeline
- Sources
- FAQ
What does inspecting pipeline data for revenue risk actually involve?
Start with six fields on every material opportunity: Amount, Close Date, Stage, Forecast Category, Next Step, and Last Activity Date. These fields tell you almost everything about whether a deal is real or hopeful. An amount that jumped without a corresponding scope change, a close date that has moved twice in a month, or a blank “next step” field are all signals worth a question before they become a surprise.
Pipeline Inspection is built for exactly this. Once historical trending is switched on for opportunities, it annotates changes to amount, close date, forecast category and stage, so you can see movement rather than just a snapshot. The Trailhead module on Pipeline Inspection also describes an insights panel that flags recent changes automatically, though what appears depends on your admin’s configuration.
Run these checks as routine before every review, not just when something feels wrong:
- Deals with no logged activity in over 14 days, sorted by amount descending.
- Any deal pushed out of the current period more than once this quarter.
- Opportunities missing a next step or a next step older than the close date.
- Suspected duplicate records, particularly where two reps have logged near-identical company names.
- Deals where amount changed by more than 20% without a stage change to match.
CRM hygiene failures like these are common enough to be structural rather than exceptional. Fairview’s hygiene research found that poor data practices can materially inflate pipeline totals and quietly eat into the hours reps should be spending with buyers. A short weekly filter catches most of it before it reaches the forecast call.
Which deals deserve your attention before the call?
Not every open opportunity needs scrutiny. Materiality is what separates a genuine forecast risk from noise, and you define it by three lenses: deal value against your average, contribution to quota coverage, and percentage of the gap between pipeline and target. A £15,000 renewal rarely needs a second look. A £180,000 new-logo deal sitting in “Best Case” with no activity in three weeks always does.
Score what remains against six dimensions:
- Activity recency — days since last logged touch, weighted more heavily as close date approaches.
- Buyer engagement — multi-threaded contact or single champion only.
- Decision-maker alignment — confirmed economic buyer versus assumed.
- Competing risk — named competitor, budget freeze, or internal reorganisation flagged in notes.
- Stage age — days in current stage against your historical average for that stage.
- Historical win rate — how deals of this size, source and stage have actually closed before.
Two triage rules do most of the work. Flag anything “large and stale”: above your materiality threshold with no activity in 14 days. Flag anything with a wide “commit gap”: where the model number and the rep’s submitted commit disagree by more than a set percentage. Bookmark both lists and that becomes your pre-call shortlist, not the full pipeline.
Pro Tip: Build the shortlist the day before the call, not during it. A rubric applied in the moment gets rushed; applied calmly the day before, it holds up under questioning.
Fairview’s research on forecasting cadence notes that a short, repeatable triage rubric shifts forecast calls from status updates to actual decision conversations, which is the entire point of doing this work before the meeting rather than during it.
How do you build a forecast call you can defend afterwards?
A defendable forecast starts with the model number, not the rep’s opinion. Pull the weighted pipeline model first and present it before anyone speaks. That anchors the conversation in the system of record rather than in whoever argues most confidently in the room.
Compare that model number against what each rep has actually submitted as their commit. The gap between the two is your agenda. If the model says £2.1m and the rep says £2.6m, spend the call finding out why, not rubber-stamping the higher figure.
Pipeline Forecasts supports this directly. Once adjustments are enabled in your org’s collaborative forecasting setup, managers can apply an override on top of the rolled-up model and that adjustment is visible rather than buried. The discipline that matters is capturing the reasoning behind every adjustment at the point it’s made, not reconstructing it from memory a week later when someone asks why the number changed.
A simple four-part structure keeps the call tight:
- Model number — what the system produced, unadjusted.
- Rep commit — what was submitted, and the size of the gap.
- Adjustments — any override applied, with the evidence and reasoning behind it, recorded at the time.
- Final commit and actions — the number you’re taking upstairs, plus who owns which follow-up.
Recording that rationale as you go, rather than after the fact, is what makes the call auditable later. This is precisely where a record of evidence, not just a spreadsheet snapshot, earns its place. Reviewing that same rationale against what actually closed weeks later is one of the fastest ways to calibrate your own judgement.
What weekly rhythm keeps forecast prep from eating your week?
Three steps, run in order, on a fixed schedule:
- Rep updates by a set deadline — Friday close of business works well for most teams, giving reps the weekend gap and RevOps a clean Monday pull.
- RevOps model pull and pre-call analysis — the flagged “large and stale” list, the commit-gap list, and a note on any deal where a prior week’s judgement was recorded, all ready before the call starts.
- The review call itself — model number first, gap second, adjustments third, actions last.
Fairview’s forecasting framework research identifies this weekly cadence, built around updates, a model pull and a review call, as the single biggest driver of forecast accuracy improvement for most teams, ahead of switching methodology or tooling.
Close the loop with a short post-call movement review the following week: which flagged deals actually moved, which stalled, and whether last week’s adjustment turned out to be right. That’s where coaching happens. Run the current quarter weekly. A bi-weekly pass on the quarter after is usually enough, since those deals move more slowly and don’t need the same scrutiny yet.
What tools actually support the inspection and defence work?
Salesforce gives you the raw material. Pipeline Inspection surfaces changes to amount, close date, stage and forecast category once historical trending is switched on, and its flow charts let you visualise pipeline movement by whichever metric you select. Pipeline Forecasts handles the model rollup and lets you apply and see adjustments, provided your admin has enabled that setting.
What Salesforce doesn’t give you natively is a durable, ranked record of why a deal was flagged and what happened afterwards. That’s the gap CommitControl fills, using only read-only Salesforce access:
- Ranks material exposure across the book, so the shortlist builds itself rather than requiring manual filtering every week.
- Shows the supporting evidence behind each ranked deal, not just a score.
- Lets owners record Locked Calls and notes at the point of judgement, not reconstructed afterwards.
- Uses Receipts to compare earlier risk signals against what the deal eventually did, win or lose.
- Requires no rep login and no new data entry, so it adds no workflow for the sales team.
Signals from any tool, Salesforce’s own features or otherwise, are not proof. They’re a prompt to ask a better question on the call. Full detail on data handling sits on the security and EU data residency page.
How do you spot a deal slipping before the rep says anything?
The reliable early signals rarely show up as one dramatic red flag. They show up as small deviations from a deal’s own pattern. A champion who replied within a day for three weeks and has now gone quiet for ten is a stronger signal than a generic “no activity” rule, because it’s a change from that specific deal’s baseline, not just an absolute threshold.
Watch for engagement dropping on the buyer side specifically, not just the rep side: fewer opens on shared documents, meeting requests declined or pushed twice, or a single-threaded deal where the one named contact stops responding. A deal that was multi-threaded and has quietly narrowed to one contact is a materially different deal from the one you scored three weeks ago, even if every field still says the same stage.
Unexplained amount changes deserve particular suspicion. A deal that grows 30 percent with no note on expanded scope, or shrinks with no note on a cut requirement, usually means someone adjusted the number to make the forecast look better rather than because the deal changed. Cross-reference amount jumps against stage and next-step fields; if they moved independently of each other, ask why before the call, not during it.
Stage regression, a deal moving backward, is rarer than stalling but far more diagnostic. It almost always means a real objection surfaced that the rep hasn’t yet fully explained in their notes. Treat any backward stage move as an automatic inclusion on the pre-call shortlist regardless of deal size.
How do you put a number on deal-level revenue risk?
The simplest useful method is risk-adjusted revenue: multiply the deal’s amount by a probability figure drawn from your own historical win rate for deals of that stage, size band and source, rather than the flat percentage Salesforce assigns by stage alone. A £200,000 deal in a stage that closes 40 percent of the time historically carries £80,000 of risk-adjusted value, whatever the stage’s default probability says.
Layer a second adjustment for activity decay. If a deal has gone quiet against its own established pattern, discount the risk-adjusted figure further, even before the stage itself changes. This catches deals that are technically still “Commit” on paper but functionally cooling.
A third and often overlooked calculation is concentration risk at the book level: what percentage of this quarter’s total forecast sits in the top five deals. If that figure is above roughly a third of quota, a single slipped deal can move the whole number materially, and that’s worth surfacing to leadership as a structural risk, not just a deal-by-deal one.
None of this needs to be a statistical model. A spreadsheet with historical win rate by segment, updated quarterly as more deals close, will outperform guesswork by a wide margin and takes an afternoon to build.
How do you capture what reps know that the CRM doesn’t show?
The fields tell you what happened. They rarely tell you what a rep actually believes, and that gap is where the most useful risk information usually hides. A rep will often tell you in a hallway conversation that a deal is shakier than its Salesforce stage suggests, because they’ve picked up on hesitation that hasn’t yet produced a field change.
Build a short, standard prompt into weekly updates rather than leaving qualitative colour to chance: one line per material deal on “what would need to be true for this to close on time.” That single question surfaces more genuine risk than a dozen dropdown fields, because it forces the rep to state an assumption rather than just a status.
Capture that colour as a note tied to the specific deal and the specific week, not as a general comment buried in a Slack thread that disappears. The value of qualitative input compounds when it’s timestamped and attached to the record it concerns, because you can compare what was said against what actually happened later.
Resist the temptation to turn every rep comment into a new custom field. That’s how CRMs end up with forty fields nobody fills in consistently. A structured note, reviewed weekly and referenced at the call, does the job without adding a new data-entry burden on top of what reps already do.
How should you set up dashboards to surface risk, not just totals?
Most pipeline dashboards default to showing volume: total pipeline, deals by stage, amount by owner. None of that tells you where the risk sits. Rebuild the primary dashboard around exposure instead: the “large and stale” list, the commit-gap list, and stage-age outliers, each as its own component rather than buried in a filtered view someone has to remember to apply.
A waterfall or flow chart view, of the kind Pipeline Inspection provides, is worth pinning prominently because it shows movement between snapshots rather than a static total. A number that looks stable week to week can hide deals sliding out while new ones slide in, and the flow view is what catches that churn.
Keep the report count small. Five focused reports that get checked every week beat twenty that get built once and ignored. Prioritise the fields that actually drive the decisions you make in the review, amount, close date, stage age, last activity, over vanity metrics like total pipeline count. If a report doesn’t change a decision on the call, it doesn’t need a permanent place on the dashboard.
Should external market data feed into your Salesforce risk view?
External signals, funding news, hiring freezes, leadership changes at the buyer, add real value, but only once your internal data is trustworthy. The pipeline integrity research from Integrate makes a point worth taking seriously: automation and enrichment scale whatever data foundation already exists, broken or clean. Feeding market intelligence into a CRM with duplicate accounts and stale fields just multiplies the noise.
Once hygiene is under control, prioritise enrichment fields that actually change scoring: company size, industry, title, and email validity first, since these drive routing and risk weighting more than most secondary firmographic data. A validated title field that shows a champion has moved companies is a far stronger revenue-risk signal than a generic firmographic overlay.
Bring external data in as a supplementary note on the account or opportunity, reviewable during pre-call analysis, rather than as an automated score override. A leadership change at the buyer should prompt a human question on the call, not silently downgrade a deal’s forecast category without anyone noticing why.
How do you train reps to enter data without adding new work?
The instinct is to add fields and mandate them. That usually backfires, producing dropdown answers reps pick at random to get past a required field. The better approach ties data quality to something reps already care about: forecast accuracy affecting their own commission conversations, and pipeline reviews that go faster when their deals are well documented.
Coach on the “next step” field specifically, since it’s the single field most predictive of whether a deal is actually moving. A next step with a date and a named action is a different deal from one with a vague note like “follow up.” Make that distinction explicit in one-to-ones rather than leaving it to a training deck nobody reads twice.
Use the monthly hygiene audit as a coaching tool, not a compliance exercise. Fairview’s research recommends a focused 60-minute audit against a short rule set; walking a rep through their own flagged deals during that audit teaches the habit far faster than a policy email. The partner guide from Kept on keeping field logic in plain language is a useful reference if you want to explain to reps, in non-technical terms, why a field matters and what happens to the data once they enter it.
Reward accurate “at risk” flagging as much as accurate “closing” flagging. A rep who correctly identifies a shaky deal early is doing better forecasting work than one who quietly kept it at 90 percent until it collapsed in the final week.
An honest view on tools, judgement and evidence
Software can rank exposure and surface a stale deal in seconds. It cannot tell you whether a champion’s silence means a lost budget or just a busy week, and pretending otherwise is where forecast tools overreach. The discipline that actually improves forecasting isn’t better scoring, it’s recording the judgement behind each call so you can check it against what happened. Use tools to remove the busywork of finding what needs attention, not to remove the decision itself. If you want to see how a read-only evidence trail sits alongside your own weekly rhythm, a demo-tenant forecast review is a low-friction way to find out before changing anything in production.
— Brian
See what CommitControl surfaces in your own pipeline
CommitControl is the practical layer between your Salesforce data and your forecast call: it ranks material exposure automatically, shows the evidence behind each flagged deal, and lets you record a Locked Call with your reasoning at the point you make it, so nothing gets reconstructed from memory a week later.
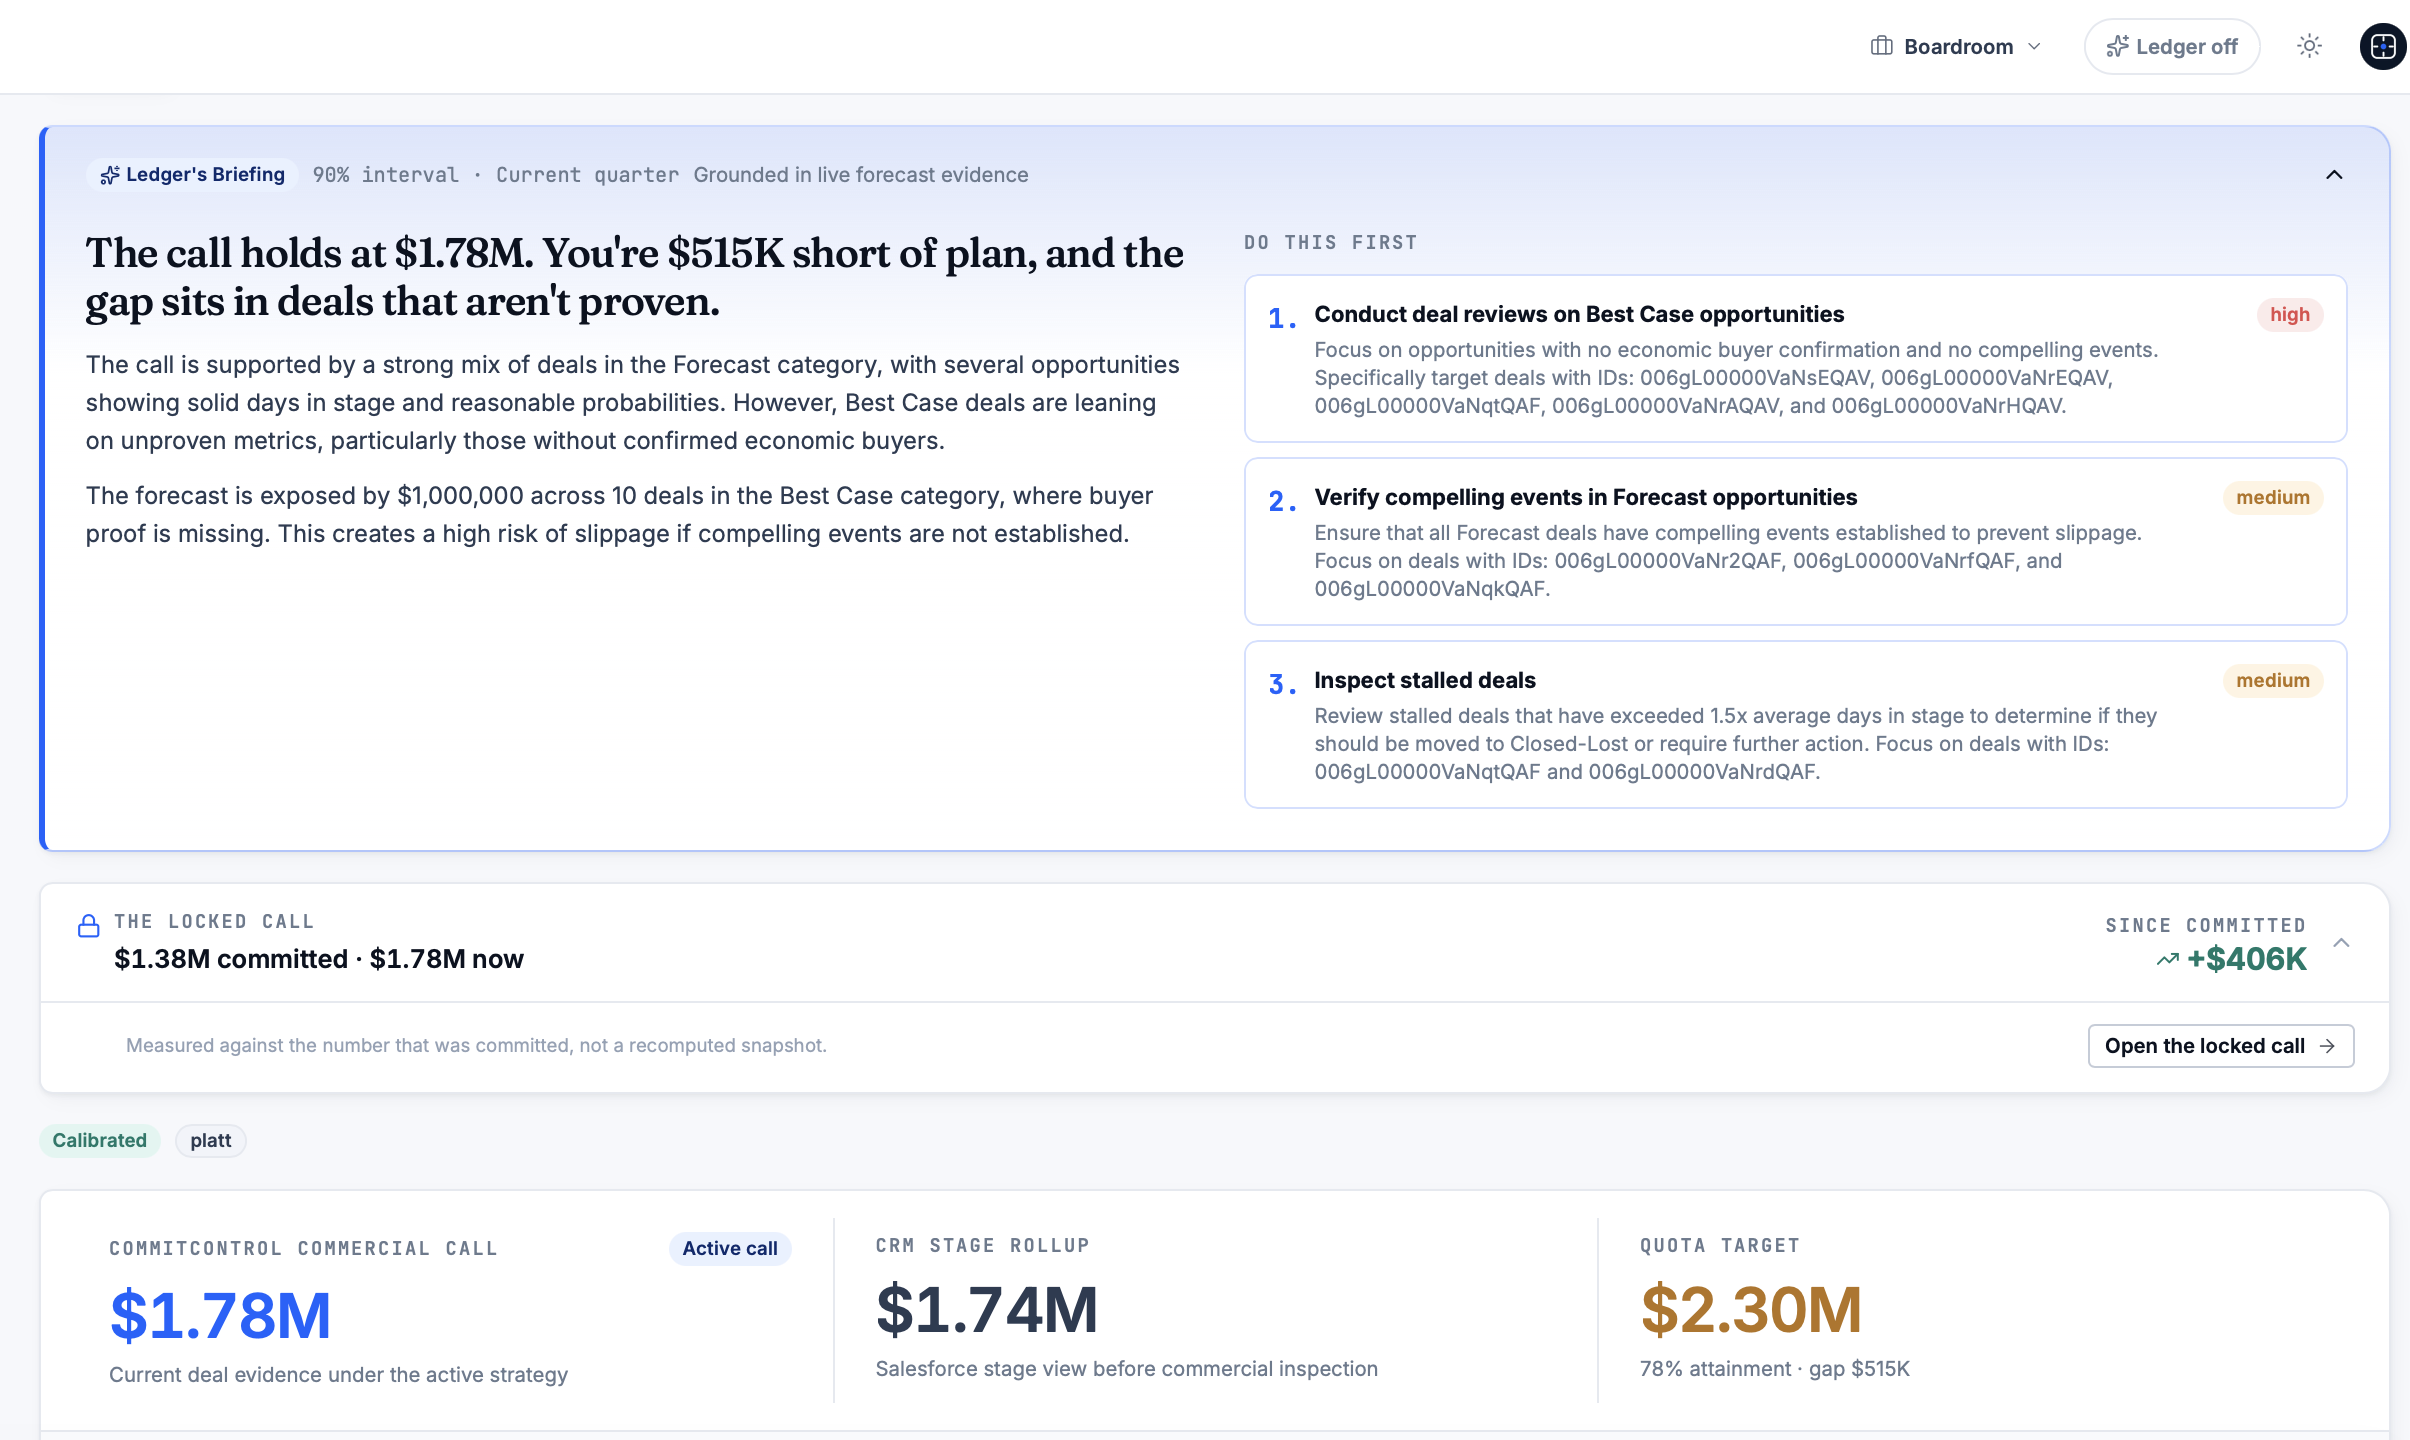
It runs on read-only Salesforce access, so there’s no rep login and no new data-entry routine to roll out. Receipts let you go back and check whether last month’s risk signal actually predicted the win or the loss, which is how the whole system gets sharper over time rather than staying a static scorecard. Plans are named Insight, Command, Executive and Enterprise, with pricing detailed on the plans page starting at €249 per month for Insight; Enterprise pricing is available on request. If procurement needs the detail first, the security and GDPR page covers EU data residency and access controls. The most useful next step is a demo-tenant walkthrough against your own book: book one and see your actual exposure ranked before you commit to anything.
Sources
- Turn on Pipeline Inspection | Salesforce Help
- Discover Pipeline Inspection | Trailhead
- CRM Hygiene: How to keep your pipeline data accurate | Fairview
- Pipeline integrity playbook for B2B enterprises | Integrate
FAQ
What is revenue risk management in Salesforce?
It’s the practice of identifying, scoring and managing deal-level exposure in your pipeline so you can prioritise material opportunities and prepare a forecast that holds up under questioning. It relies on inspecting fields like amount, close date and last activity rather than trusting stage alone.
How often should you run a pipeline risk review?
Weekly for the current quarter, with a bi-weekly pass for the quarter after that. A weekly cadence built around rep updates, a model pull and a review call is the strongest single driver of forecast accuracy for most teams.
What counts as a “material” deal worth flagging?
Materiality depends on your own quota and pipeline size, but a common approach flags deals above your average deal value, or those representing a large share of the gap between pipeline and target. Combine that threshold with stale activity or a wide commit gap to build your shortlist.
Does CommitControl require reps to log into another system?
No. CommitControl uses read-only Salesforce access only, so reps keep working exactly as they do now with no new login or data-entry step. Leaders get material exposure ranking, evidence and Locked Call recording without adding a workflow for the sales team.
What does CommitControl cost?
Plans are named Insight, Command, Executive and Enterprise. Insight starts at €249 per month, Command at €899 per month, and Executive at €1999 per month, with full detail on the pricing page; Enterprise pricing is available on request.
Recommended
Editorial content. All metrics are Salesforce-derived and reviewed for accuracy. Not a substitute for professional judgment.
See the same discipline applied to your pipeline.
CommitControl derives every figure from your own Salesforce data. Nothing is invented, and every number traces back to the record it came from. Connect Salesforce and the same view runs live on your data within 24 hours.
Evaluate CommitControl