Probability calibration means mapping the chance-to-close values reps enter in Salesforce to what actually closes, so a “70%” deal closes roughly seven times in ten. Run this diagnostic today: pull Commit versus actual close rates for the last four quarters, then strip out any deal without documented buyer evidence. What is left is your real forecast. What gets cut tells the board exactly where the padding lives.
TL;DR:
- Accurate calibration requires regular review of commit versus actual close rates over four quarters, with deals lacking buyer evidence removed from analysis.
- Inconsistent commit definitions, deal with no recent activity, and high turnover among new reps significantly worsen forecast accuracy if not addressed.
- Calibration should be based on transparent, rule-based probability bands derived from historical conversion data, rather than complex statistical models.
- Assign clear ownership: reps log evidence, managers verify within 14 days, and RevOps maintains definitions and calibration processes.
- Automating evidence tracking with tools like CommitControl ensures reproducible, evidence-linked scores that improve forecast credibility and decision-making.
Table of Contents
- What is probability calibration in Salesforce forecasting?
- How do you calibrate probabilities in 30, 60 and 90 days?
- Which metrics prove your forecast is calibrated?
- Who owns each part of the forecast process?
- What statistical methods do teams use to calibrate probabilities?
- Calibration versus discrimination: what is the difference?
- How do calibration plots and reliability diagrams help?
- Does probability calibration apply outside CRM forecasting?
- What limits how well you can calibrate a forecast?
- Why does sample size and data quality decide whether calibration works?
- Why deterministic scoring makes calibration defensible at board level
- Turning calibration into an operating system with CommitControl
- Sources
- FAQ
What is probability calibration in Salesforce forecasting?
Miscalibration rarely comes from bad intentions. It comes from three specific, fixable problems sitting inside your CRM data right now.
Rep subjectivity is the first. Two reps looking at similar deals will assign different probabilities based on gut feel, not evidence. One calls a deal 80% because the prospect “seemed engaged.” Another calls a near-identical deal 50% because they are naturally cautious. Neither number is wrong exactly. Neither is calibrated either.
Inconsistent Commit definitions compound this. If your sales methodology never wrote down what qualifies a deal for Commit, every rep invents their own bar. Some commit deals with a signed mutual close plan. Others commit deals where someone on the buying side said “this looks good.” Forecast inaccuracy usually traces back to unclear definitions and weak evidence requirements rather than the CRM tool itself.
AE tenure matters more than most leaders assume. New reps and teams with high turnover produce measurably worse baseline commit accuracy, because they have not yet learned what a real buying signal looks like versus a polite email reply.
Run two checks in Salesforce this week:
- Pull Commit versus closed-won for each of the last four quarters and calculate the variance percentage for each.
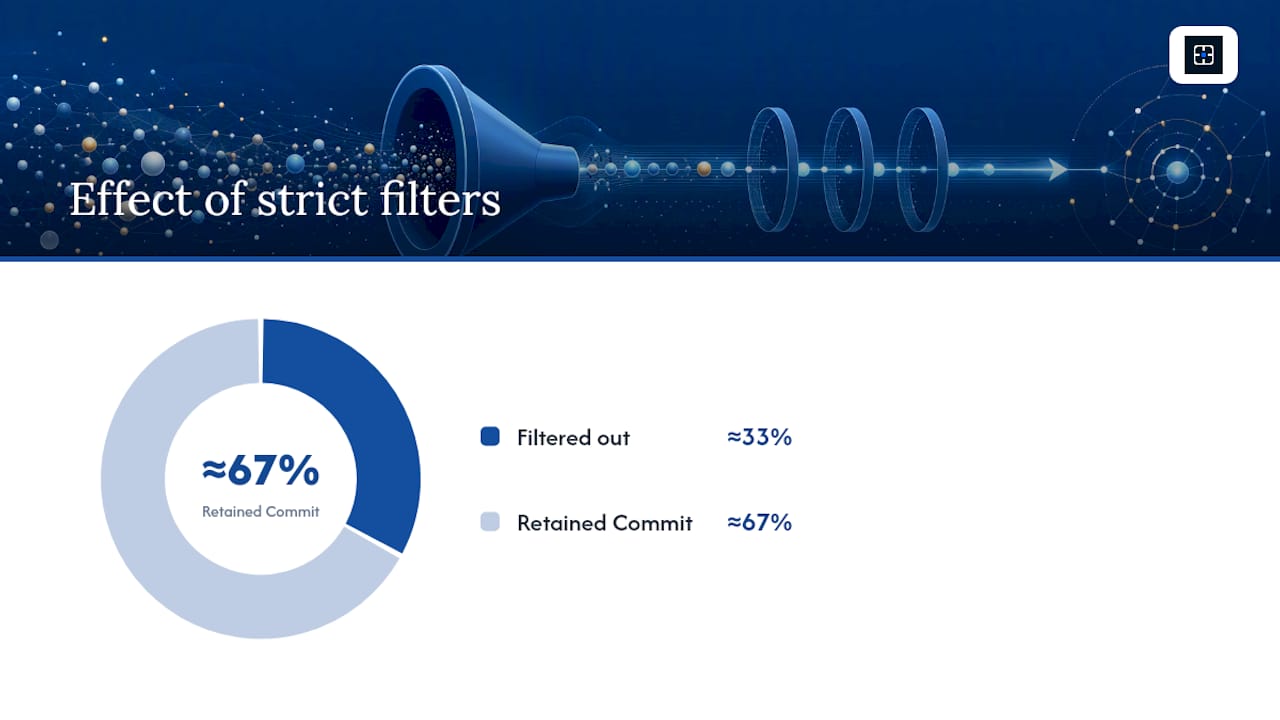
- For the current quarter’s Commit deals, apply a strict filter: economic buyer identified, activity logged in the last 30 days, and a defined next step with a date.
Use these fields and filters in your report builder: Close Date, Last Activity Date, Economic Buyer (custom field if you have one), Next Step, and Probability. A common quick filter approach removes deals missing a close date, showing no activity in 30 days, lacking an identified economic buyer, or sitting below 25% probability. This alone often cuts apparent Commit coverage by a third or more.
- Deals with no activity logged in 30 days
- Deals with no named economic buyer
- Deals with a next step but no date attached
- Deals sitting in the same stage for two consecutive quarters
Pro Tip: Pull your last 10 Commit misses from closed-lost or slipped deals and log which evidence item was missing from each: no economic buyer, no recent activity, or no dated next step. The pattern that repeats most often tells you exactly which filter to enforce first.
How do you calibrate probabilities in 30, 60 and 90 days?
Calibration is a sequence, not a single project. Trying to fix everything in week one guarantees you fix nothing properly.
Days 1 to 30: baseline and filter.
- Measure your current Commit accuracy against the last four quarters, unfiltered.
- Write down, in one page, what qualifies a deal for Commit: buyer evidence, activity recency, next step with a date.
- Apply that filter retroactively to the current quarter’s Commit list and see how much shrinks.
Days 31 to 60: build the bands.
- Calculate historical conversion rates by stage: what percentage of deals in each stage actually closed, looking back over at least four quarters.
- Convert those observed rates into calibrated probability bands. If deals entering your “Proposal” stage close 55% of the time historically, that stage should carry a probability near 55%, not whatever a rep types in.
- Apply the new bands to weighted pipeline and recalculate your forecast using the calibrated figure instead of the rep-entered one.
- Require a manager inspection note on every Commit deal within 14 days of it entering Commit.
Days 61 to 90: automate and review.
- Set alerts for Commit deals with no activity in 14 days or a next step past its date.
- Rewrite stage exit criteria so a deal cannot advance without a buyer action, not a rep judgment call.
- Run a formal post-quarter accuracy review: compare called Commit to actual closed-won, identify which reps or segments drove the variance, and coach specifically on the gap.
AI and ML-assisted forecasting can lift accuracy by roughly 15 to 25 percent when the underlying CRM data is clean and there is enough history to work from. That figure depends entirely on data quality. Automating a recalibration process on top of undocumented Commit criteria and missing activity logs will not produce that lift. It will just automate the guesswork faster.
Which metrics prove your forecast is calibrated?
Four numbers tell you whether calibration is working. Track them on a rolling four-quarter basis, not quarter by quarter, because single-quarter swings hide the trend.
Commit accuracy measures how close your called Commit number lands versus actual closed-won. Best case accuracy measures the same for your upside category. Weighted pipeline accuracy checks whether your probability-weighted total pipeline value tracked reality. Forecast variance is the percentage gap between what you called at the start of the quarter and what actually closed.
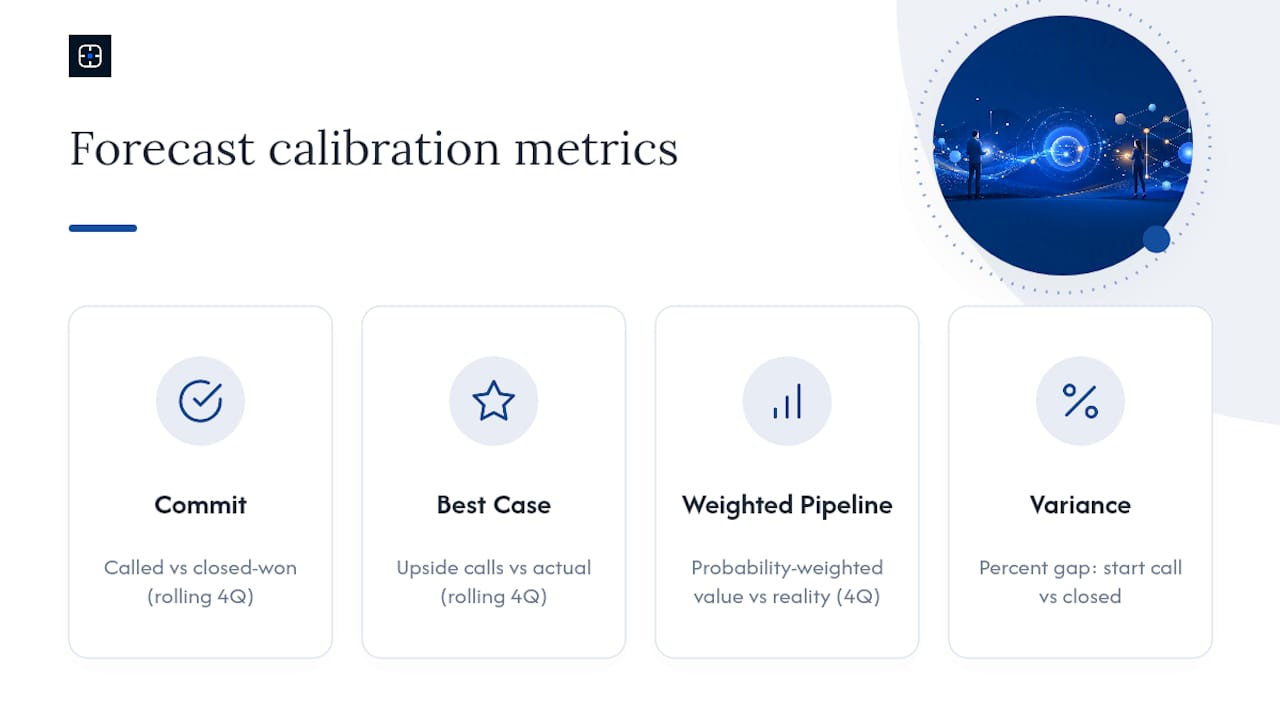
A single blended forecast number tends to obscure risk. Reporting Commit, Best Case, and Pipeline as separate categories, rather than one collapsed figure, gives the board a clearer read on where confidence is genuinely high versus speculative.
Horizon matters too. A forecast called 90 days out will carry more variance than one called at 30 days, simply because more can change. Track accuracy separately at each horizon rather than judging a 90-day call by the same bar as a 30-day one.
These benchmark ranges come from B2B SaaS forecast accuracy data, and top-performing organisations using disciplined or AI-assisted methods achieve variance in the 5 to 10 percent range. Build a Salesforce dashboard around three components: a Commit-versus-actual trend line over eight quarters, a stage-conversion table refreshed monthly, and a filtered view of Commit deals missing any evidence field.
Who owns each part of the forecast process?
Calibration collapses without clear ownership. Assign it explicitly, not by implication.
- Reps log activity, identify the economic buyer, and set a dated next step. That is the evidence layer.
- Managers inspect every Commit deal within 14 days of it entering Commit and record a written note confirming the evidence stands up.
- RevOps maintains the stage definitions, runs the quarterly conversion-rate analysis, and keeps the calibrated probability bands current.
- The CRO owns the post-quarter accuracy review and decides when stage definitions need to change.
Weekly forecast calls should follow one rule: inspect the evidence, not the rep’s confidence. If a Commit deal has no logged activity in two weeks, it gets challenged in the call, regardless of how the rep frames it. Fixing forecast accuracy is fundamentally a staged operational process: document criteria, enforce evidence-based stage exits, require inspection, then review.
Change control matters as much as the cadence. Stage definitions should not shift mid-quarter on a manager’s preference. Log every change to Commit criteria with a date and the reason, so a board member asking “why did accuracy jump this quarter” gets a documented answer, not a shrug.
Pro Tip: Add a required “Manager Inspection Date” field to any opportunity above a defined ACV threshold. Make it mandatory before the deal can sit in Commit past 14 days. Salesforce validation rules can enforce this without adding a step reps have to remember.
What statistical methods do teams use to calibrate probabilities?
Two approaches dominate how organisations translate raw scores into probabilities that match reality: adjusting a model’s output curve to fit observed outcomes, or binning historical results into buckets and assigning each bucket its actual close rate. The bucket method is what most sales operations teams should use, because it is transparent. A rep or a board member can see exactly why a “Proposal” stage deal carries 55% probability: because 55% of Proposal-stage deals closed over the last eight quarters.
Curve-fitting methods borrowed from statistics can produce a smoother probability estimate, but they trade transparency for precision. If a forecast number cannot be explained in one sentence to a CFO, it has already failed the test that matters most for board defensibility. The mechanism behind a score is less important than whether the same inputs reliably produce the same output, and whether every number tracing back to that output can be checked against actual Salesforce records.
This is the core tension in choosing a calibration approach for revenue forecasting: sophistication versus auditability. A method that requires a data scientist to explain is a method your CRO cannot defend unassisted in a board meeting. Simpler, rule-based probability bands, built from your own historical conversion data and reviewed quarterly, tend to hold up better under scrutiny than a black-box adjustment nobody in the room can fully explain.
Calibration versus discrimination: what is the difference?
Calibration and discrimination answer two different questions, and conflating them is a common mistake in forecast reviews. Discrimination asks: can this scoring approach rank deals correctly, so the deals most likely to close score higher than the ones least likely to close? Calibration asks a separate question: when a deal is scored at 70%, does it actually close 70% of the time?
A forecasting approach can have excellent discrimination and poor calibration simultaneously. It might rank every deal in the right order, best to worst, while still being wrong about the actual percentage attached to each one. This happens often with rep-entered probabilities. A rep’s gut sense of which deals are stronger is frequently accurate as a ranking. Their confidence that a specific deal is “70%” likely to close is a separate skill entirely, and it is the one most reps have never been trained on.
For board-level forecasting, calibration matters more than discrimination. A CFO does not need the pipeline ranked correctly. A CFO needs the weighted total to land close to what actually closes. That is why fixing evidence standards and stage-exit criteria, which directly improve calibration, produces more forecast credibility than any change aimed purely at reordering which deals look strongest.
How do calibration plots and reliability diagrams help?
A calibration plot is simple to build in a spreadsheet and worth doing once a quarter. For each bucket, calculate the actual percentage that closed. Plot called probability against actual close rate.
Most sales organisations, when they run this exercise for the first time, find something closer to an S-curve.
This one chart, built from data every Salesforce instance already contains, is usually the single most convincing document in a calibration project. It shows the CRO exactly where the probability scale is broken, bucket by bucket, without requiring anyone to trust a black-box adjustment. Run it quarterly and track whether the line straightens over time. If it does not move after two quarters of enforcing evidence standards, the problem is not the probability scale. It is that reps are not actually applying the new stage-exit criteria, and that is a coaching and inspection failure, not a data one.
Does probability calibration apply outside CRM forecasting?
Yes, and understanding the wider context helps explain why sales leaders should be cautious about importing methods built for a different problem.
Those environments have advantages sales forecasting does not. Classifier calibration usually runs on enormous datasets, often millions of labelled examples, refreshed continuously, with a single consistent definition of the outcome being predicted. A spam classifier does not have twelve different reps each applying their own personal definition of “spam.”
Sales forecasting has none of those conditions by default. Deal volumes at a mid-market company might be a few hundred closed opportunities a year. Definitions of “qualified” or “Commit” vary rep to rep unless explicitly standardised. This is precisely why importing statistical recalibration techniques wholesale from the machine learning world, without first fixing definitions, evidence, and cadence, tends to disappoint. The technique works. The inputs feeding it usually do not.
What limits how well you can calibrate a forecast?
No calibration method fixes a broken input. This is the limitation that catches most revenue leaders off guard when they first attempt it.
If reps are still entering probabilities based on gut feel, recalculating the bands around those numbers will not make them accurate. It will just apply a more defensible-looking wrapper to the same guesswork. Calibration also degrades over time if stage definitions or buyer criteria change without a corresponding update to the probability bands. A stage exit rule tightened mid-year makes the previous four quarters of conversion history less reliable for setting future bands.
Sales cycles that vary wildly in length within the same pipeline create another problem. A 30-day deal and a nine-month enterprise deal do not calibrate cleanly against the same probability scale, because the evidence signals available at each stage differ by cycle length. Segmenting calibration by deal size or product line, rather than running one blended scale across the whole pipeline, usually produces more honest numbers.
Finally, calibration is never a one-time fix. Markets shift, buyer behaviour changes, and a probability band calibrated on last year’s economy may not hold this year. Calibration is fundamentally an operational discipline, not a tool you install once: definitions, evidence and cadence have to be revisited every quarter, not set and forgotten.
Why does sample size and data quality decide whether calibration works?
Calibration built on a small number of deals is calibration built on noise. If a stage only closed 20 deals over the last year, the observed conversion rate for that stage could easily be off by a wide margin purely by chance. A mid-market company with modest deal volume needs to pool at least four quarters, and sometimes more, before the stage-conversion numbers are stable enough to trust.
Data quality matters just as much as volume. A conversion rate calculated from Salesforce records where activity logging is inconsistent, close dates get pushed without explanation, and stage history is incomplete will produce a calibration band that looks precise and is actually wrong. A genuine data culture, where every function treats the CRM as the system of record, is what makes forecast accuracy improvements durable rather than temporary.
Before calibrating anything, audit the data itself. Check what percentage of closed deals over the last year have a complete activity history, a logged economic buyer, and an accurate stage-entry date. If that percentage is low, fix the logging discipline first. Calibrating probabilities against incomplete records just produces a more sophisticated version of the same unreliable number.
Why deterministic scoring makes calibration defensible at board level
Calibrated probability bands only earn trust if the number behind them can be reproduced and checked. That is the case for deterministic scoring over opaque model outputs: the same inputs always produce the same score, every signal traces back to a specific Salesforce field, and a manager or CRO can explain any individual score in one sentence.
Most vendors in this space rely on models where the reasoning behind a score is not fully visible, even to the vendor. That might improve raw accuracy in some environments.
— Brian
Turning calibration into an operating system with CommitControl
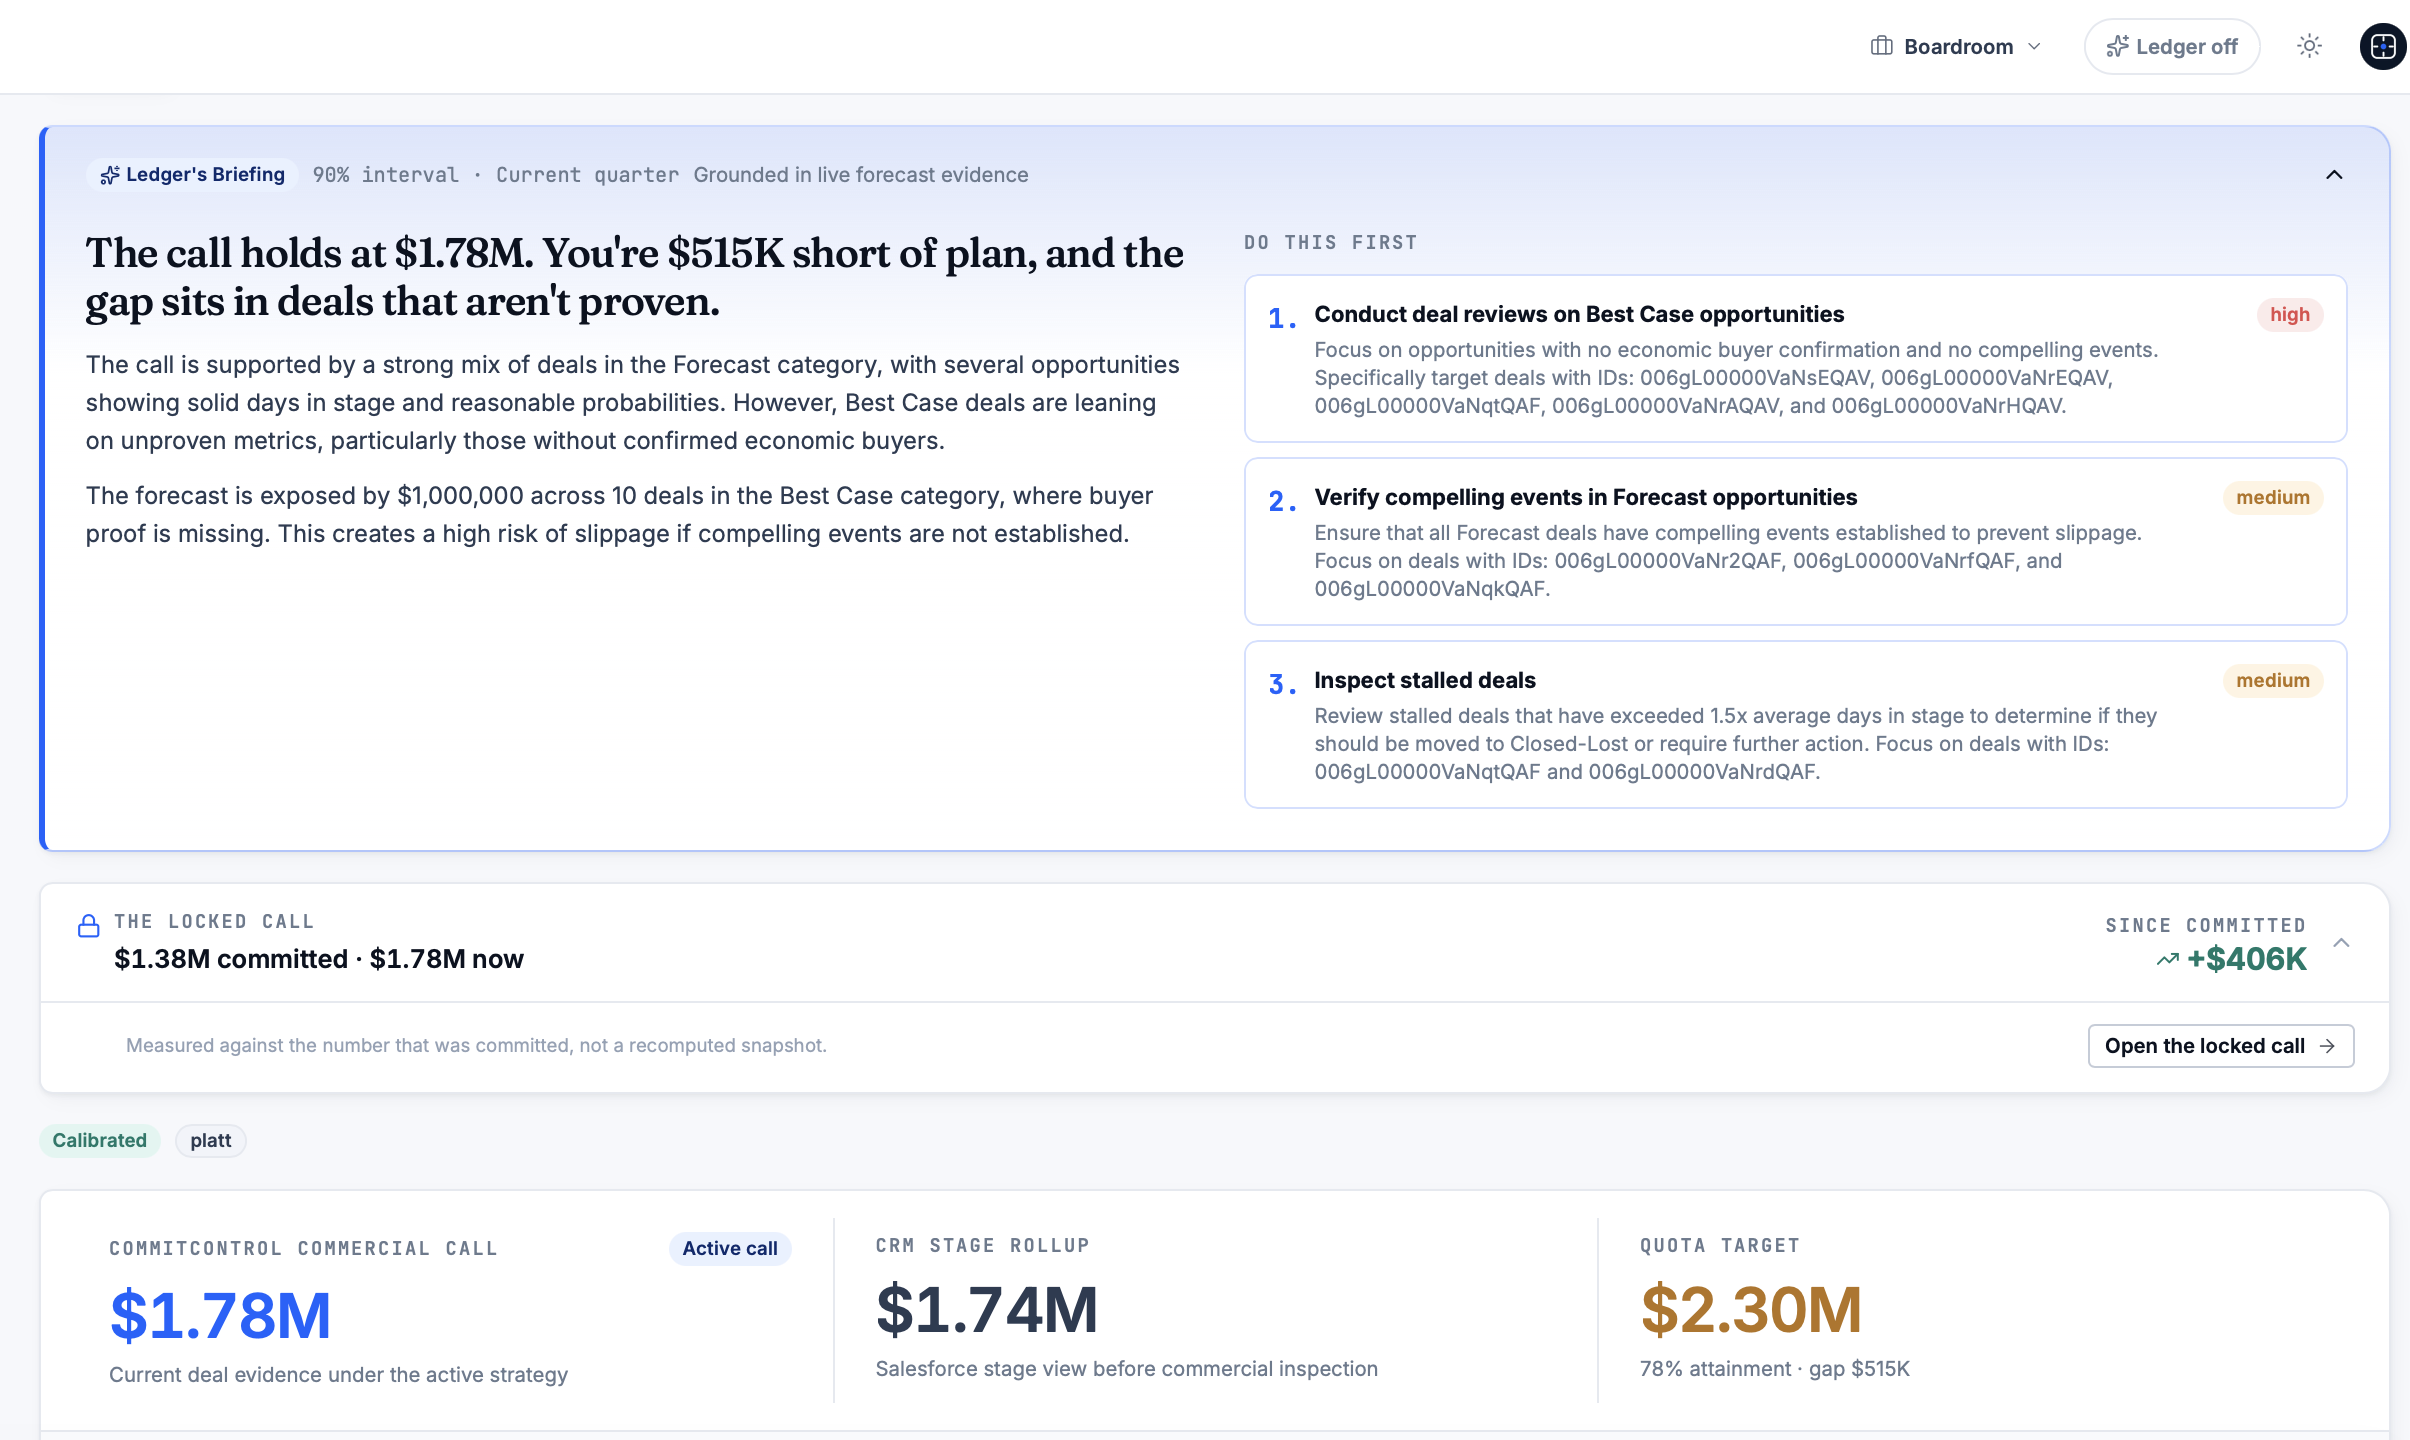
Everything above works better with a system that ties calibrated probability bands directly to Salesforce evidence, automatically, every week. CommitControl scores deals deterministically: the same inputs always produce the same score, and every score traces back to a specific field, activity, or manager note you can open and check. There is no black-box adjustment sitting between your CRM data and the number your board sees.
If you want to know what a miscalibrated forecast is actually costing you in cash terms, the Sales Forecast Miss ROI Calculator turns your own Commit-versus-actual variance into a pound figure. Leaders stepping into a new sales seat, or inheriting a forecast they did not build, can use the sales leadership transition reset to rebuild evidence standards and Commit criteria from day one rather than inheriting the previous leader’s guesswork. Start with the CommitControl product page to see how the scoring and evidence trail work, then book a walkthrough to see it running against your own pipeline.
Sources
- Sales forecast accuracy benchmark | Optifai
- Why sales forecasts are wrong | Revelynk
- B2B SaaS sales forecast accuracy benchmarks 2026 | GrowthSpree
FAQ
What is probability calibration in sales forecasting?
It is the process of checking whether the chance-to-close percentages reps enter in Salesforce match the rates those deals actually close at, then adjusting stage definitions and evidence rules until they do.
How often should we recalibrate Commit probabilities?
Review conversion rates and Commit accuracy quarterly, and run a full recalibration of probability bands at least once a year or whenever stage definitions change.
What is a reasonable commit accuracy benchmark?
A median around 85% is typical for B2B SaaS teams, with top-quartile performers exceeding 95%.
Can CommitControl replace our current probability scoring?
CommitControl replaces opaque probability scoring with deterministic, evidence-linked scores drawn directly from Salesforce fields, which is designed for exactly the auditability calibration work needs.
Does automating calibration remove the need for manager inspection?
No. Automation flags evidence gaps faster, but a manager still needs to verify buyer evidence and record an inspection note on Commit deals within 14 days.
Recommended
Editorial content. All metrics are Salesforce-derived and reviewed for accuracy. Not a substitute for professional judgment.
See the same discipline applied to your pipeline.
CommitControl derives every figure from your own Salesforce data. Nothing is invented, and every number traces back to the record it came from. Connect Salesforce and the same view runs live on your data within 24 hours.
Evaluate CommitControl