Pipeline waterfall analysis shows exactly why a forecast changed by decomposing pipeline movement into seven buckets: what you started with, what got added, what progressed, what regressed, what closed, and what got pushed. It answers the question every CRO dreads at the board table: why did we call £1.2m and land £1.7m, or worse, the other way round. You need Salesforce field history tracking to build one properly.
TL;DR:
- A pipeline waterfall analysis requires enabling Opportunity field history tracking on Stage, Amount, and CloseDate before analyzing movement.
- It should be run monthly for pattern spotting and weekly in the last six weeks of a quarter to detect actionable regressions and pushes.
- A high push rate exceeding a quarter of open pipeline indicates loose stage criteria, while rising regression rates suggest premature deal advancement.
- Discrepancies in deal count and value, especially with few large deals skewing pipeline health, reveal underlying issues.
- Relying on a waterfall necessitates disciplined data collection to produce trustworthy, defendable forecast adjustments.
Table of Contents
- What pipeline waterfall analysis actually measures
- When a waterfall earns its keep, and when a snapshot will do
- Building a pipeline waterfall in Salesforce: the setup checklist
- Reading the waterfall: the diagnostics that matter
- A worked example: turning the equation into a chart
- What revenue leaders do differently once they read the waterfall correctly
- Why deterministic scoring makes waterfall findings defensible
- The gap between waterfall theory and waterfall practice
- Turning waterfall diagnostics into a commit number you can defend
- Sources
- FAQ
What pipeline waterfall analysis actually measures
A pipeline waterfall analysis takes two snapshots of your pipeline, usually a week or a month apart, and accounts for every deal that moved between them. Nothing is allowed to vanish unexplained. Every dollar and every deal has to land in one of seven buckets, and the buckets must balance.
Here is the equation: starting balance plus created plus progressed minus regressed minus closed-won minus closed-lost minus pushed equals ending balance. If your numbers do not tie out, your data has a hole in it, usually a missing history object or a report filter excluding something it should not.
The seven buckets, defined:
- Starting balance: total open pipeline value at the beginning of the period.
- Created: new opportunities added during the period.
- Progressed: deals that advanced a stage without closing.
- Regressed: deals pushed backwards a stage, a quiet warning sign most dashboards hide.
- Closed-won: deals that closed and generated revenue.
- Closed-lost: deals marked lost or disqualified.
- Pushed: deals with a Close Date moved into a future period, still open.
Dollar value alone can mislead you. A pipeline that holds steady in value while deal count drops sharply usually means a handful of large deals are propping up a shrinking base, and that base will not survive contact with the next quarter. Layer the two together and the story gets honest fast.
When a waterfall earns its keep, and when a snapshot will do
Build a waterfall when you need to diagnose why a forecast missed or why the same deals keep slipping quarter after quarter. It is a forensic tool: it tells you where pipeline actually went, not where you hoped it would go. If your CRO wants to know why the number moved £500k between Monday and Friday, a snapshot report cannot answer that. A waterfall can, because it tracks the movement itself rather than a single point in time.
A snapshot is enough for a quick coverage check: how much pipeline exists right now against quota, sliced by stage or owner. Do not reach for a waterfall to answer that question. It is heavier to build and slower to read than the job requires.
The misuse to avoid: treating the waterfall as a forecasting model. It is not predictive. As Salesforce’s own research on pipeline management versus forecasting points out, most organisations conflate the two, and a waterfall only tells you what already happened, not what will happen next quarter.
Pro Tip: Run a lightweight waterfall monthly for pattern-spotting, and only build a detailed weekly one during the final six weeks of a quarter, when regression and push data actually change your commit.
Building a pipeline waterfall in Salesforce: the setup checklist
None of this works without history data, and history data cannot be recovered after the fact. If field tracking was off last quarter, last quarter is gone for waterfall purposes.
- Enable Opportunity field history tracking on Stage, Amount, and CloseDate. This is the single change that separates a team that can diagnose pipeline movement from one that cannot. Salesforce’s guidance on pipeline inspection is explicit that standard snapshot reporting will not capture this movement at all.
- Confirm tracking start date. Salesforce’s help documentation on historical trending confirms history tracking cannot be backfilled. Teams routinely discover this the day they try to build their first waterfall and find three months of blank history.
- Pull from OpportunityHistory (or an equivalent history object) rather than the Opportunity object itself, so you capture every Stage, Amount, and CloseDate change, not just the current state.
- Handle edge cases explicitly: a deal pulled into the current period and lost within the same period should register in both created and closed-lost, not cancel itself out. A same-period push, where a rep moves Close Date forward and back within one cycle, needs its own flag or it will inflate your push rate artificially.
- Validate the balance equation before you trust the chart. If starting plus created plus progressed minus regressed minus closed-won minus closed-lost minus pushed does not equal your ending balance, something in your extraction logic is wrong.
Most teams find this checklist takes an afternoon of admin time and saves weeks of arguing over whose pipeline number is correct.
Reading the waterfall: the diagnostics that matter
The buckets only earn their value once you turn them into thresholds you act on. A high pushed rate, deals with Close Date repeatedly moved forward, is usually the first sign of a forecast built on hope rather than evidence. Practitioner experience across RevOps teams suggests that when pushed deals routinely exceed a quarter of open pipeline value, the underlying stage criteria are too loose, letting deals sit in a stage they have not earned.
Regressions deserve equal attention. A deal moving backwards a stage is not neutral. It usually means the rep advanced it too early, or a champion went quiet, or procurement reopened a conversation that was supposedly closed. Track regressions as a rate, not a raw count: regressed value divided by starting pipeline value. A rising trend here, quarter over quarter, points at a qualification problem before it shows up as a missed number.
Compare created against closed-won over the same window. If creation is climbing but closed-won is flat, you are filling the top of the funnel without fixing whatever is stalling deals lower down.
Key diagnostics to watch:
- Push rate: pushed value divided by starting pipeline value; a rising trend signals weak exit criteria.
- Regression rate: regressed value as a share of starting pipeline; flags premature stage advancement.
- Creation vs won ratio: healthy pipelines show both growing together, not one masking the other’s stagnation.
- Velocity anomalies: deals sitting far longer in a stage than the historical average for that stage.
None of these thresholds are universal rules.
A worked example: turning the equation into a chart
Take a simple quarter. Starting pipeline: £2.0m across 40 deals. Over the quarter: £600k created (12 new deals), £400k progressed to later stages, £150k regressed back a stage, £500k closed-won, £300k closed-lost, and £250k pushed into next quarter.
Run the equation: £2.0m + £600k − £150k − £500k − £300k − £250k = £1.4m ending balance. (Progressed does not change total pipeline value, since it moves deals between stages rather than in or out.)
On a waterfall chart, this becomes six bars stepping down from the £2.0m starting bar to the £1.4m ending bar, with created rising and the four outflows falling, exactly the format Trailhead’s guide to building a waterfall chart walks through when grouping by stage and summing pipeline amount.
- Check deal count alongside value: if that £500k closed-won came from only 3 deals against 40 starting, your average deal size just tripled, worth investigating before you assume health.
- Check the £250k pushed against how many of those 12 newly created deals are already stalling, since new pipeline pushed within its first quarter is a different problem than mature pipeline pushed for the fourth time.
- Recheck the balance. If it does not land on £1.4m, trace back through the extraction before presenting the chart to anyone.
What revenue leaders do differently once they read the waterfall correctly
The diagnostics only matter if they change what happens in the next forecast meeting. When regressions run high, the fix is rarely a pep talk. Tighten and document stage exit criteria so a deal cannot advance to Commit without a specific, checkable artefact, a signed mutual close plan, a confirmed budget owner, rather than a rep’s confidence.
Set inactivity windows: if a deal has had no logged activity in 30 or 45 days, it should not sit quietly in a healthy-looking stage. Pair that with mandatory loss reasons, structured, not free text, so pattern analysis is possible six months later instead of a graveyard of “other.”
When push or creation rates shift meaningfully quarter over quarter, adjust your forecast weightings rather than holding last quarter’s assumptions constant. A forecast model that never updates its stage-to-close probabilities against actual waterfall history is just guessing with extra steps.
- Document stage exit criteria and audit them quarterly against regression rates.
- Require a loss reason field on every closed-lost opportunity.
- Flag any deal with no activity logged in 30 days for manager review.
- Recalibrate stage weightings when push or creation rates move more than a few points.
Pro Tip: Bring the waterfall itself, not just the summary number, into forecast defence meetings. Showing the CFO exactly which bucket moved the number is far more convincing than restating a revised total.
Why deterministic scoring makes waterfall findings defensible
A waterfall tells you what happened. It does not, on its own, tell a board why a specific deal’s forecast category is trustworthy today. That gap is where most forecasting tools lose credibility, because a black-box score that shifts overnight with no visible reason gives leadership nothing to defend.
Deterministic scoring closes that gap by tying every score directly to the same Salesforce history that built your waterfall: the same Stage, Amount, and CloseDate changes. Same inputs, same score, every time, with no hidden recalibration between tenants. When a waterfall flags a regression spike, a deterministic score built on that same history lets a sales leader trace the exact fields that moved and why the number changed, rather than trusting a model’s internal judgement.
That traceability matters most in the moment it is needed least conveniently: mid quarter, under pressure, in front of the CFO.
The gap between waterfall theory and waterfall practice
Most articles on pipeline waterfall analysis stop at the definition and the pretty chart. That is where the useful work actually starts. The judgement this analysis supports is blunt: a waterfall without disciplined Salesforce history tracking is a chart built on partial data, and partial data produces confident-looking conclusions that are wrong.
The conventional advice, build a waterfall dashboard and review it monthly, undersells how much setup discipline it demands. Field history tracking has to be switched on before you need it, not after a bad quarter prompts the question. Teams that treat this as a one-off CRM configuration task, rather than an ongoing data-quality habit, end up with waterfalls that balance on paper and mislead in practice.
Prioritise the plumbing first. Gartner’s research on generative AI and sales automation makes a point worth borrowing here: organisations get more value from retaining institutional memory and customer context than from bolting on another dashboard. A waterfall built on shaky history tracking is exactly that: another dashboard, not more memory. Partners like benchmarked make a similar case when advising sales teams on AI readiness: the process discipline behind the data matters more than the tool sitting on top of it.
— Brian
Turning waterfall diagnostics into a commit number you can defend
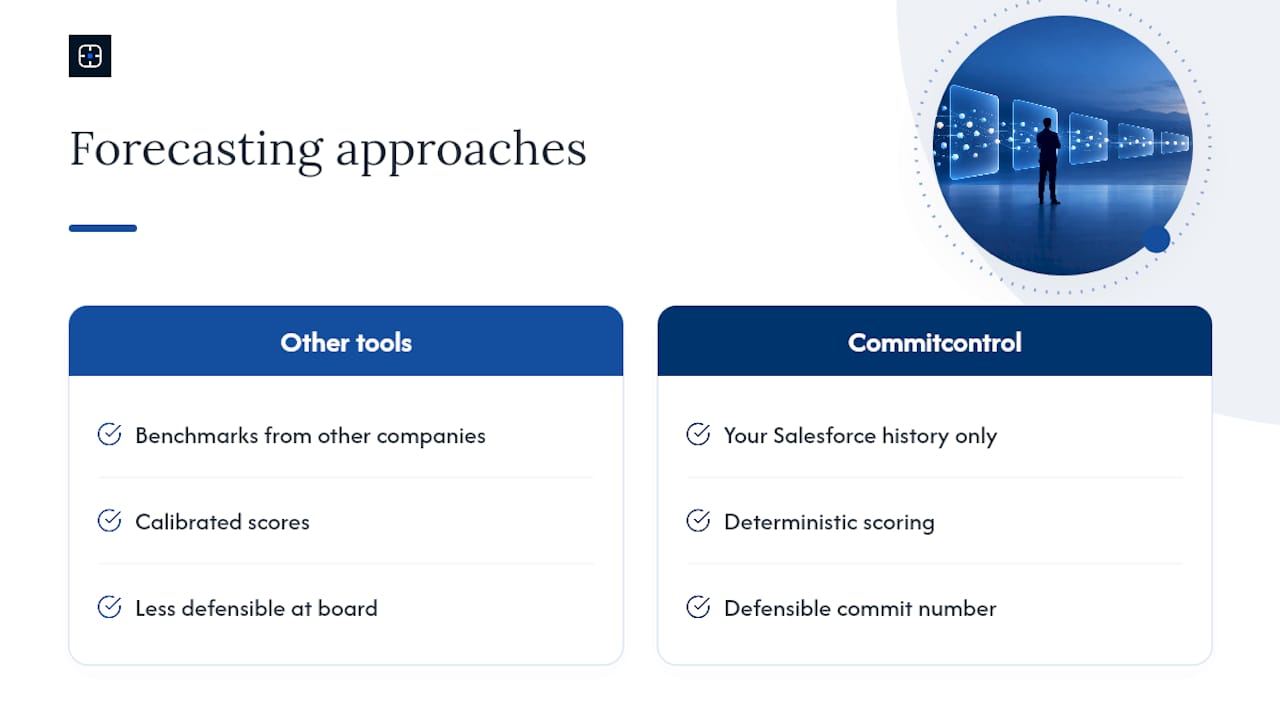
Commitcontrol is built for the moment a waterfall diagnosis needs to become a defensible forecast number, not just an interesting chart. Where most forecasting tools calibrate scores against benchmarks pulled from other companies’ data, Commitcontrol scores every deal deterministically from your own Salesforce history alone: the same Stage, Amount, and CloseDate movements your waterfall already tracks, with a visible reasoning trail behind every number.
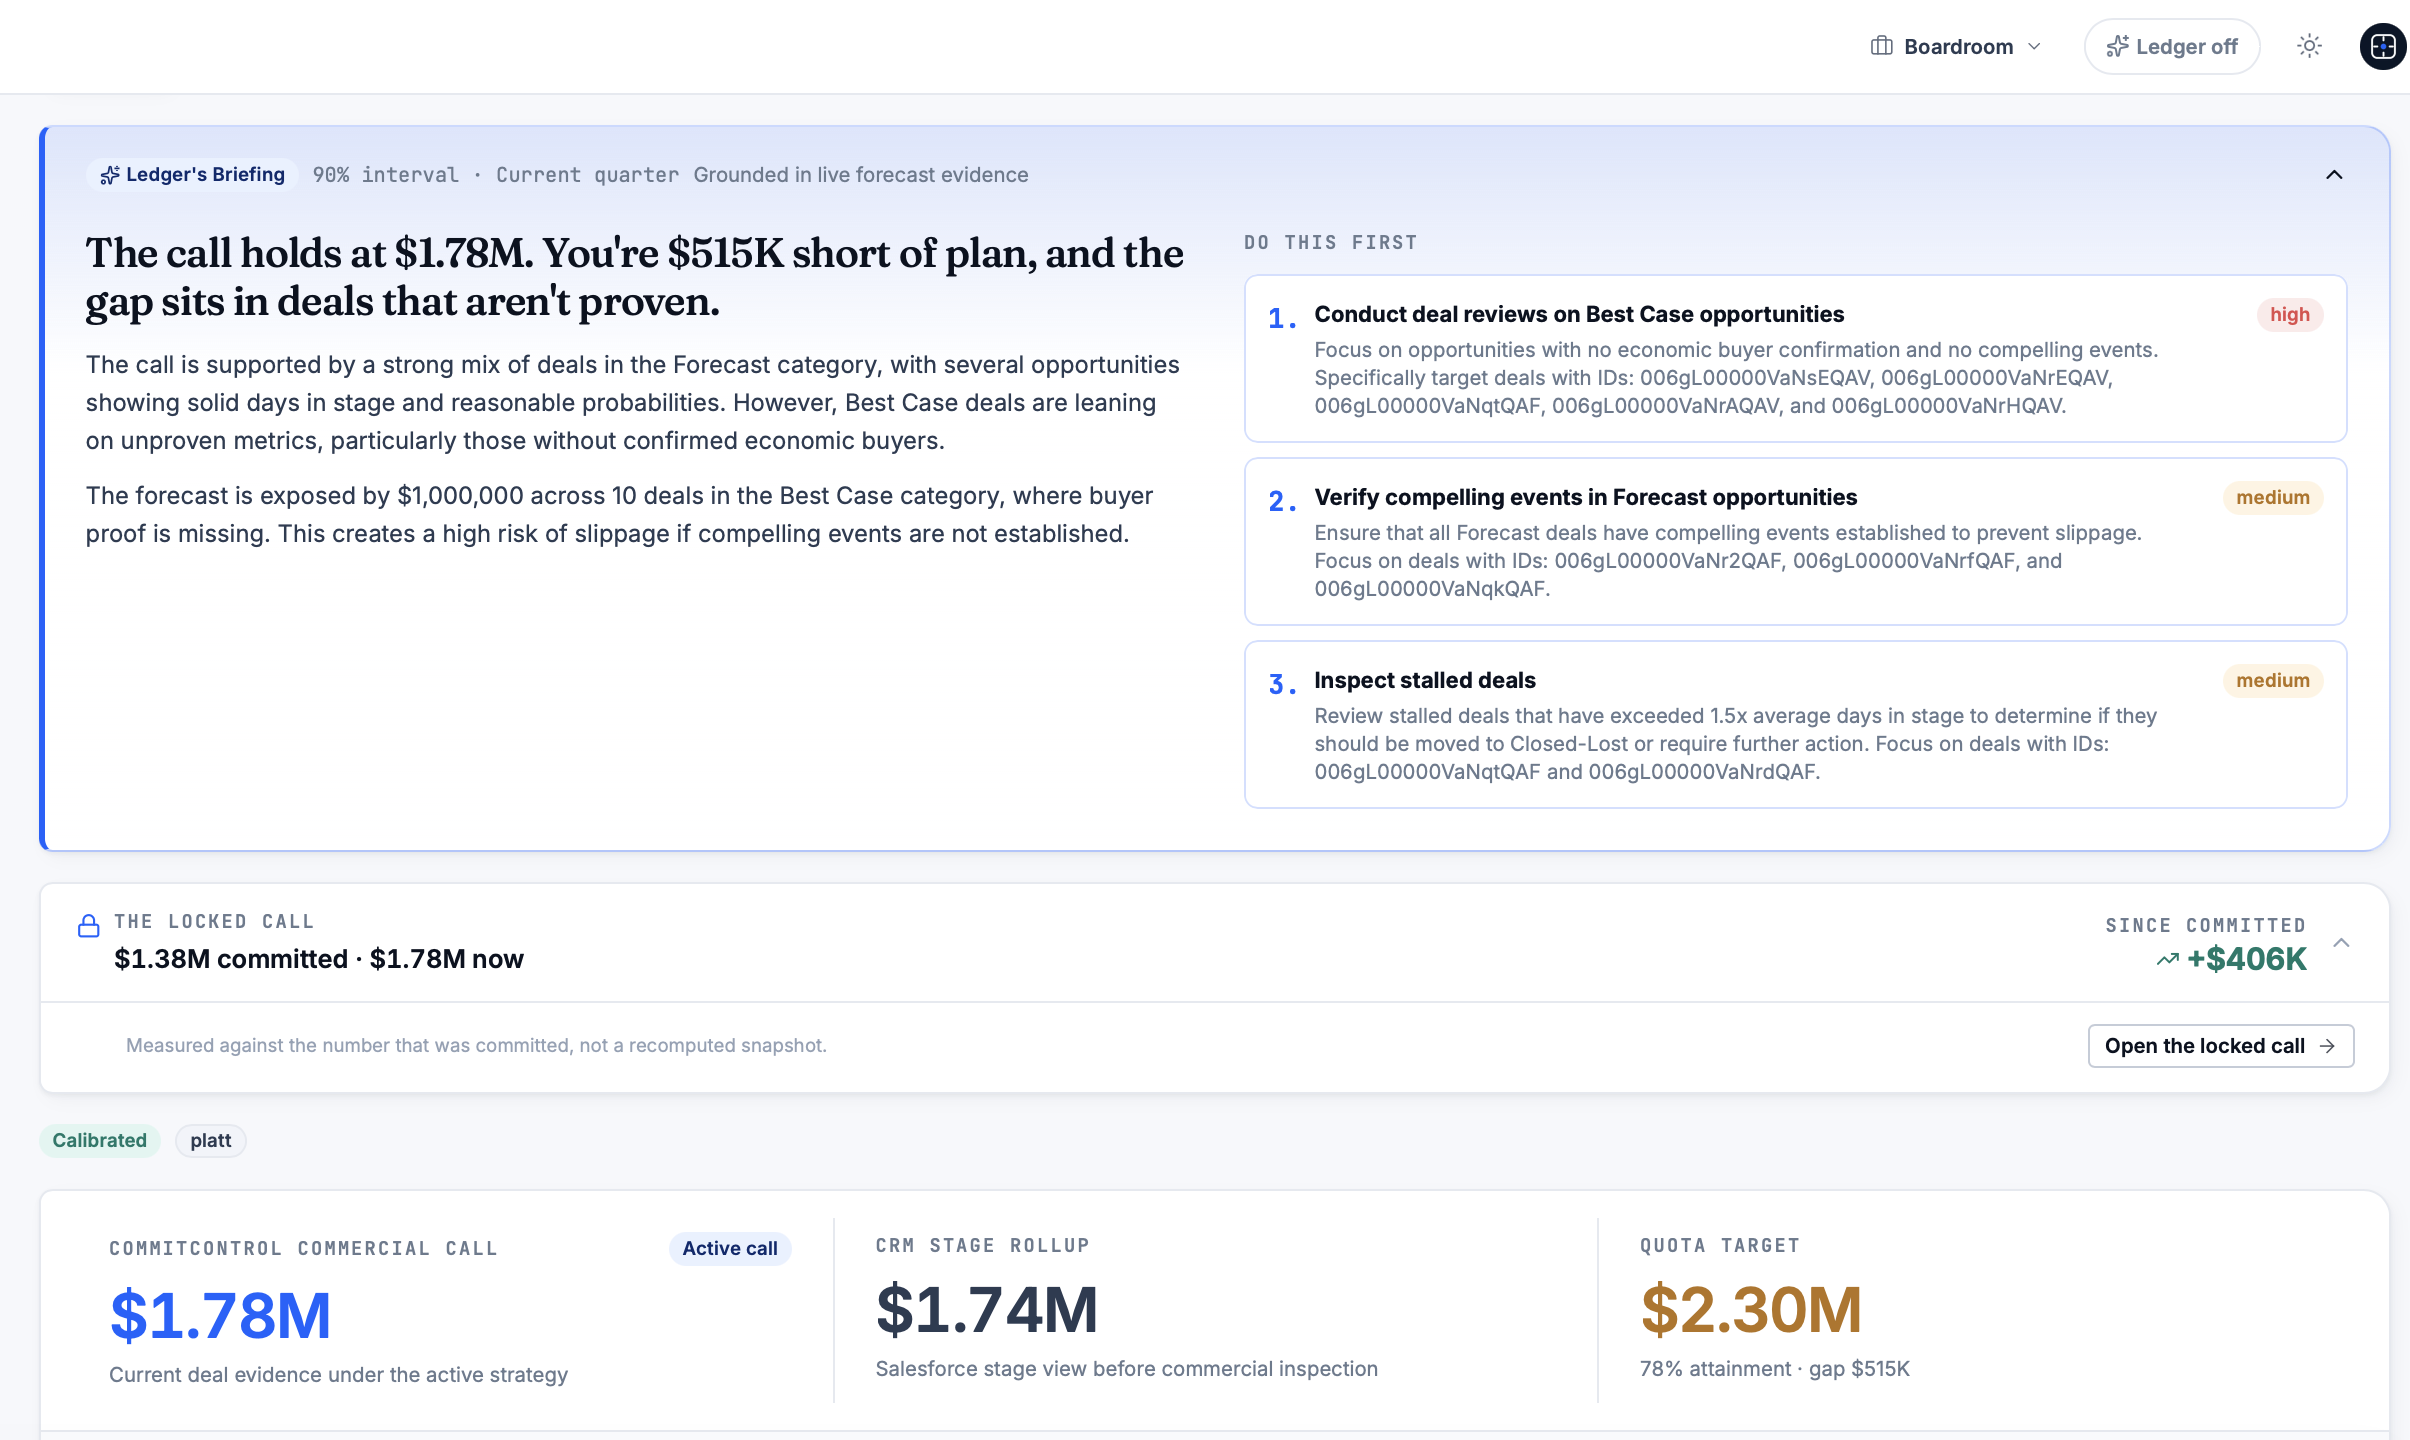
A common use case: a new VP of Sales inherits a pipeline nobody trusts. Waterfall analysis shows where the previous forecast leaked, high regressions in the mid funnel, a pushed rate creeping past a quarter of pipeline value. Commitcontrol turns that diagnosis into a reproducible commit number the new leader can walk into their first board meeting with and defend line by line, because every score traces back to CRM history a CFO can inspect directly, covered in detail on the sales leadership transition page.
Plans run from Insight at €249 per month through to Executive, with the whole team included on every tier, no per-seat pricing. If you want to see what your current forecast misses are costing you, run the numbers through the forecast miss ROI calculator or book a walkthrough to see deterministic scoring against your own Salesforce data.
Sources
For hands-on setup, start with Salesforce’s pipeline inspection guidance and the Trailhead waterfall chart project for a working example.
- Pipeline inspection vs pipeline reporting | Salesforce blog
- Salesforce help: pipeline inspection / historical trending
- Create a dashboard and add a waterfall chart | Trailhead
- Gartner: generative AI and sales automation outlook
FAQ
What is a pipeline waterfall analysis?
It is a report that decomposes pipeline movement between two points in time into seven buckets: starting balance, created, progressed, regressed, closed-won, closed-lost, and pushed. It shows exactly where pipeline value and deal count moved, rather than just a single snapshot total.
How do you interpret a pipeline waterfall chart?
Read each bar as a cause of the change between the starting and ending balance, then check the buckets against each other. A high pushed bucket or rising regression rate usually points at loose stage exit criteria, while strong creation with flat closed-won suggests deals are stalling lower in the funnel.
What does a waterfall chart tell you that a snapshot report cannot?
A snapshot shows pipeline at one moment; a waterfall shows the movement between two moments and attributes every dollar and deal to a specific cause. That distinction is why Salesforce positions pipeline inspection as diagnostic, separate from standard pipeline reporting.
How do you calculate a pipeline waterfall?
Use the balance equation: starting balance plus created plus progressed minus regressed minus closed-won minus closed-lost minus pushed equals ending balance. You need Opportunity field history tracking enabled on Stage, Amount, and CloseDate to pull the underlying movement data, since Salesforce confirms this history cannot be recovered retrospectively.
Does Commitcontrol replace the need to build a waterfall?
No. Commitcontrol works from the same Salesforce history a waterfall uses and turns that diagnosis into an auditable, deterministic commit score. Pricing starts at €249 per month on the Insight plan, with full details on all four plans listed on the pricing page.
Recommended
Editorial content. All metrics are Salesforce-derived and reviewed for accuracy. Not a substitute for professional judgment.
See the same discipline applied to your pipeline.
CommitControl derives every figure from your own Salesforce data. Nothing is invented, and every number traces back to the record it came from. Connect Salesforce and the same view runs live on your data within 24 hours.
Evaluate CommitControl