
Pipeline coverage ratio is your total open pipeline value divided by your revenue target for the same period. The number that matters isn’t a borrowed 3x rule but your own: required coverage equals 1 divided by your historical win rate. A team closing a quarter of what it works should carry coverage roughly four times their quota, not rely on an industry default. Report both raw and weighted coverage, because each tells stakeholders something different.
TL;DR:
- Teams with a win rate below 33 percent need at least 3x pipeline coverage; lower win rates require proportionally higher coverage to meet targets.
- Calculating weighted coverage requires accurate deal stage probabilities based on historical data and consistent CRM tagging, or it becomes unreliable.
- Monitoring deals with expected close dates within the current period and removing stale or inactive deals keeps coverage metrics meaningful and actionable.
- Weekly pipeline inspections focusing on deal qualification, recent engagement, and realistic close dates help prevent pipeline thinness and forecast inaccuracies.
- Using deterministic scoring tied to actual data makes coverage assessments auditable and more resistant to manipulation or optimistic bias.
Table of Contents
- What is pipeline coverage and why does it matter for forecasting?
- How do you calculate pipeline coverage? Formula and worked example
- Should you use raw or weighted pipeline coverage?
- How much pipeline coverage do you actually need?
- Which deals count in your coverage number, and how often should you measure it?
- What actually moves your coverage ratio and forecast accuracy?
- What mistakes make your coverage number misleading?
- How do you run a quick coverage check in a weekly review?
- How does deterministic scoring make pipeline coverage defensible?
- Why coverage should trigger a decision, not just a report
- Turn pipeline coverage into a number your board actually trusts
- Sources
What is pipeline coverage and why does it matter for forecasting?
Pipeline coverage ratio (sometimes called the coverage multiple) measures how much open opportunity value sits behind a revenue target. If your quarterly quota is in the hundreds of thousands and you have multiple times that in open pipeline, your coverage is healthy. That number drives decisions well beyond forecasting.
Coverage tells a CRO whether a shortfall is a pipeline problem or a conversion problem. Low coverage means you don’t have enough deals to work with, no matter how well your reps close. Adequate coverage with a missed number points to something else entirely: weak qualification, slow deal velocity, or reps who can’t close what’s in front of them. Get that diagnosis wrong and you end up hiring SDRs when the real fix was sales enablement.
The ratio also shapes resourcing decisions that sit outside the sales team:
- Hiring plans for account executives depend on whether pipeline generation is keeping pace with headcount growth.
- Marketing budget allocation often follows coverage gaps, since a chronic shortfall usually means top-of-funnel isn’t producing enough qualified volume.
- Board conversations about quota attainment start with coverage, because it’s the leading indicator investors ask for before the quarter closes.
None of this works without a defined quota source and a clean definition of what counts as qualified pipeline. A coverage ratio built on deals that were never going to close is worse than no metric at all. It gives leadership false confidence, and the miss lands as a surprise instead of a forecast that flagged the risk weeks earlier.
How do you calculate pipeline coverage? Formula and worked example
Coverage has two versions, and you need both. The raw coverage formula is straightforward:
Raw coverage = Total open pipeline value ÷ Revenue target for the period
Weighted coverage adjusts for the fact that not every deal is equally likely to close:
Weighted coverage = Σ(Deal value × Stage probability) ÷ Revenue target
Here’s a worked example for a single quarter.
- Your quota for Q2 is £600,000.
- You have 40 open deals scoped to that quarter, worth £2,400,000 in total. Raw coverage is £2,400,000 ÷ £600,000 = 4x.
- Applying stage probabilities (10% for early discovery, 40% for qualified, 70% for proposal, 90% for verbal commit) across those same 40 deals gives a weighted pipeline value of £930,000.
- Weighted coverage is £930,000 ÷ £600,000 = 1.55x.
Raw tells you what’s in the warehouse; weighted tells you what’s actually likely to ship.*
To run this calculation, you need four fields pulled cleanly from your CRM: deal value, expected close date, current stage, and deal owner. Missing or inconsistent stage data is the most common reason this exercise falls apart before it starts, because you can’t weight what you haven’t tagged consistently.
Should you use raw or weighted pipeline coverage?
Raw and weighted coverage answer different questions, and treating them as interchangeable is where a lot of forecasting confusion starts.
Raw coverage is an inventory view. It tells you how much total opportunity exists in the pipeline, full stop, with no adjustment for how likely any of it is to close. It’s simple to calculate, easy to explain to a board member who has never opened a CRM, and useful for spotting a top-of-funnel drought early.
Its weakness is obvious once you sit with it: a pipeline stuffed with early-stage discovery calls can post the same raw coverage as one full of deals in verbal commit. The number looks identical. The risk profile doesn’t.
Weighted coverage corrects for that by applying stage probabilities, but only if those probabilities reflect reality. This is where most teams cut corners:
- Stage probabilities copied from a CRM template rather than derived from your own historical win rates by stage.
- Probabilities that haven’t been recalculated in over a year, even as sales cycles and buyer behaviour shift.
- No segmentation, so a 40% “qualified” probability gets applied identically across enterprise and SMB deals with very different close patterns.
Validate stage probabilities by pulling twelve months of closed deals and calculating the actual historical close rate from each stage. Update the model quarterly.
The right approach isn’t choosing one over the other. Present raw coverage as your inventory number and weighted coverage as your forecast confidence number, side by side, every time you brief stakeholders on the quarter.
How much pipeline coverage do you actually need?

The 3x rule gets repeated so often that it’s treated as gospel, but it’s a legacy heuristic from enterprise sales cycles that predates the data most teams now have sitting in their CRM. You don’t need a rule of thumb. You need your own win rate.
The formula is simple: required coverage = 1 ÷ historical win rate. A team converting 33% of qualified opportunities needs roughly 3x coverage. Drop that win rate to 20%, and required coverage climbs to 5x. Improve it to 40%, and 2.5x is enough. The same principle applies regardless of segment, which is exactly why a single company-wide multiple so often misleads.
| Segment | Typical win rate | Required coverage |
|---|---|---|
| High-velocity SMB | 33% to 40% | 2.5x to 3x |
| Mid-market | 20% to 33% | 3x to 5x |
| Enterprise | 20% | 4x to 5x |
| Strategic / complex deals | 10% to 20% | 5x to 10x |
These ranges shift with context. Add a buffer above the calculated minimum when a meaningful share of pipeline is stale, when qualification standards have recently slipped, or when a rep is opening pipeline in a new vertical or region with no track record to lean on. In those cases, the historical win rate you’re using to set the target may not hold, and padding the number is more honest than pretending it will.
Which deals count in your coverage number, and how often should you measure it?
Scoping errors quietly wreck more coverage ratios than bad math ever does. A deal only counts toward a period’s coverage if its expected close date falls genuinely within that period, judged against your team’s typical sales cycle rather than a hopeful rep’s guess.
Set clear rules and apply them consistently:
- Scope deals by expected close date aligned to the quota period, not by creation date or last-touched date.
- Exclude or decay deals open longer than twice your average sales cycle, or any deal with no defined next step.
- Include renewals and expansions only when they map explicitly to the period’s quota rules; folding them in ad hoc distorts new-business coverage.
- Treat pipeline with no recent activity as a decayed asset, not a live one, even if it technically remains open.
Cadence matters as much as scope. Weekly monitoring keeps the current period honest, catching close-date slippage and stage aging before they compound. Monthly reviews go deeper, checking whether stage probabilities still match reality. Quarterly sessions reset targets against fresh win-rate data and inform the next period’s plan.
What actually moves your coverage ratio and forecast accuracy?
Two strategic levers sit behind every coverage problem. Either you generate more qualified pipeline, or you improve the conversion rate of what you already have. Most teams reach for the first lever by default. The second is usually cheaper and faster.
Here’s the sequence worth running before you ask marketing for more leads:
- Run a weekly pipeline inspection. Review every deal scoped to the current period for a defined next step, a realistic close date, and evidence the buyer has actually engaged recently.
- Apply gating rules at each stage. A deal shouldn’t advance to “proposal” without a documented pain point and confirmed budget authority, whatever your stage names are.
- Build decay factors into your reporting. Deals sitting untouched past your cycle threshold should automatically drop weighting rather than quietly inflating the total.
- Deploy acceleration playbooks for stalled deals. A deal stuck at the same stage for three review cycles needs a specific intervention, not another “check in next week” note.
- Segment your response. A coverage shortfall concentrated in one rep, one product line, or one region needs a targeted fix, not a company-wide pipeline generation push.
Pro Tip: If coverage is healthy but win rate is falling, don’t ask for more leads. Ask for a deal review. More pipeline on top of a conversion problem just delays the same miss.
Escalate to executive support when the shortfall is structural rather than seasonal, for instance when a whole segment has run below required coverage for two consecutive quarters. Track win rate, stage aging, and pipeline velocity alongside coverage itself. Coverage tells you volume. These three tell you whether that volume is healthy.
What mistakes make your coverage number misleading?
A coverage ratio is only as trustworthy as the pipeline behind it, and a handful of recurring errors quietly break it.
- Counting unqualified deals. A discovery call logged as an opportunity inflates the numerator without adding real coverage.
- Using inconsistent stage probabilities. Probabilities set once and never revisited, or missing a quota source entirely, make weighted coverage meaningless.
- Relying only on company-level coverage. An aggregate number can look healthy while individual segments run dangerously thin.
- Letting rep behaviour distort the input. Sandbagging and happy-ears optimism both push deal values and close dates away from reality, in opposite directions.
Fix these at the data layer, not the reporting layer. Clean CRM hygiene and consistent gating rules solve more coverage problems than any dashboard redesign.
How do you run a quick coverage check in a weekly review?
Take a rep carrying £750,000 in open pipeline against a £250,000 quarterly quota. That gap alone tells you this pipeline is thin on late-stage, high-confidence deals, whatever the raw number suggests.
Now run the mental-maths check. Raw coverage below the target derived from the rep’s win rate indicates insufficient pipeline even before weighting. The rep needs more qualified pipeline, not just better deal management.
A three-step checklist covers most of what a weekly review needs:
- Scope. Confirm every deal counted actually has a close date inside the current period, not carried over from a slipped forecast.
- Ageing. Flag anything sitting past twice the average cycle length for immediate review or removal.
- Evidence. Check that each deal above the qualified stage has a documented next step and recent buyer engagement, not just a stage label.
Run this in under ten minutes per rep, and coverage stops being a number you report and starts being one you can act on.
How does deterministic scoring make pipeline coverage defensible?
Coverage math only holds up if the inputs behind it are trustworthy, and that’s usually where things break down. Stage probabilities drift, deals get advanced without evidence, and by the time you present a coverage number to the board, nobody can say with confidence why a deal is weighted the way it is.

Some revenue intelligence platforms address that gap by applying deterministic scoring, fixed, transparent rules tied directly to Salesforce data, so every score comes with a readable evidence trail showing exactly why a deal sits where it does.
That matters most in the room where coverage gets challenged:
- Every score is auditable, so a CFO asking “why is this deal at 70%?” gets an answer, not a shrug.
- Weighted coverage built on deterministic scores is far harder to inflate through sandbagging or happy ears.
- Forecast defence becomes a conversation backed by evidence rather than a rep’s gut feel.
If you want to see what a forecast miss actually costs before you fix the underlying data, the Sales Forecast Miss ROI Calculator puts a number on it.
Why coverage should trigger a decision, not just a report
Coverage only earns its place on a dashboard if it changes what happens next. Too many revenue teams treat it as a vanity number, reported once a month and nodded at, rather than a trigger for a specific action: pause hiring, escalate a segment, or push a rep review. The teams that get real value from this ratio inspect it weekly, not quarterly, because a coverage gap caught in week three of the quarter is fixable. Caught in week ten, it’s just an explanation for a miss that already happened. Frequent inspection changes the entire tone of forecast conversations, from justifying a number after the fact to defending a plan while there’s still time to act on it.
— Brian
Turn pipeline coverage into a number your board actually trusts
This approach replaces the guesswork in probabilistic scoring with deterministic, auditable logic tied directly to Salesforce data, so your coverage ratio comes with a reasoning trail instead of a shrug when someone asks why a deal is weighted the way it is.
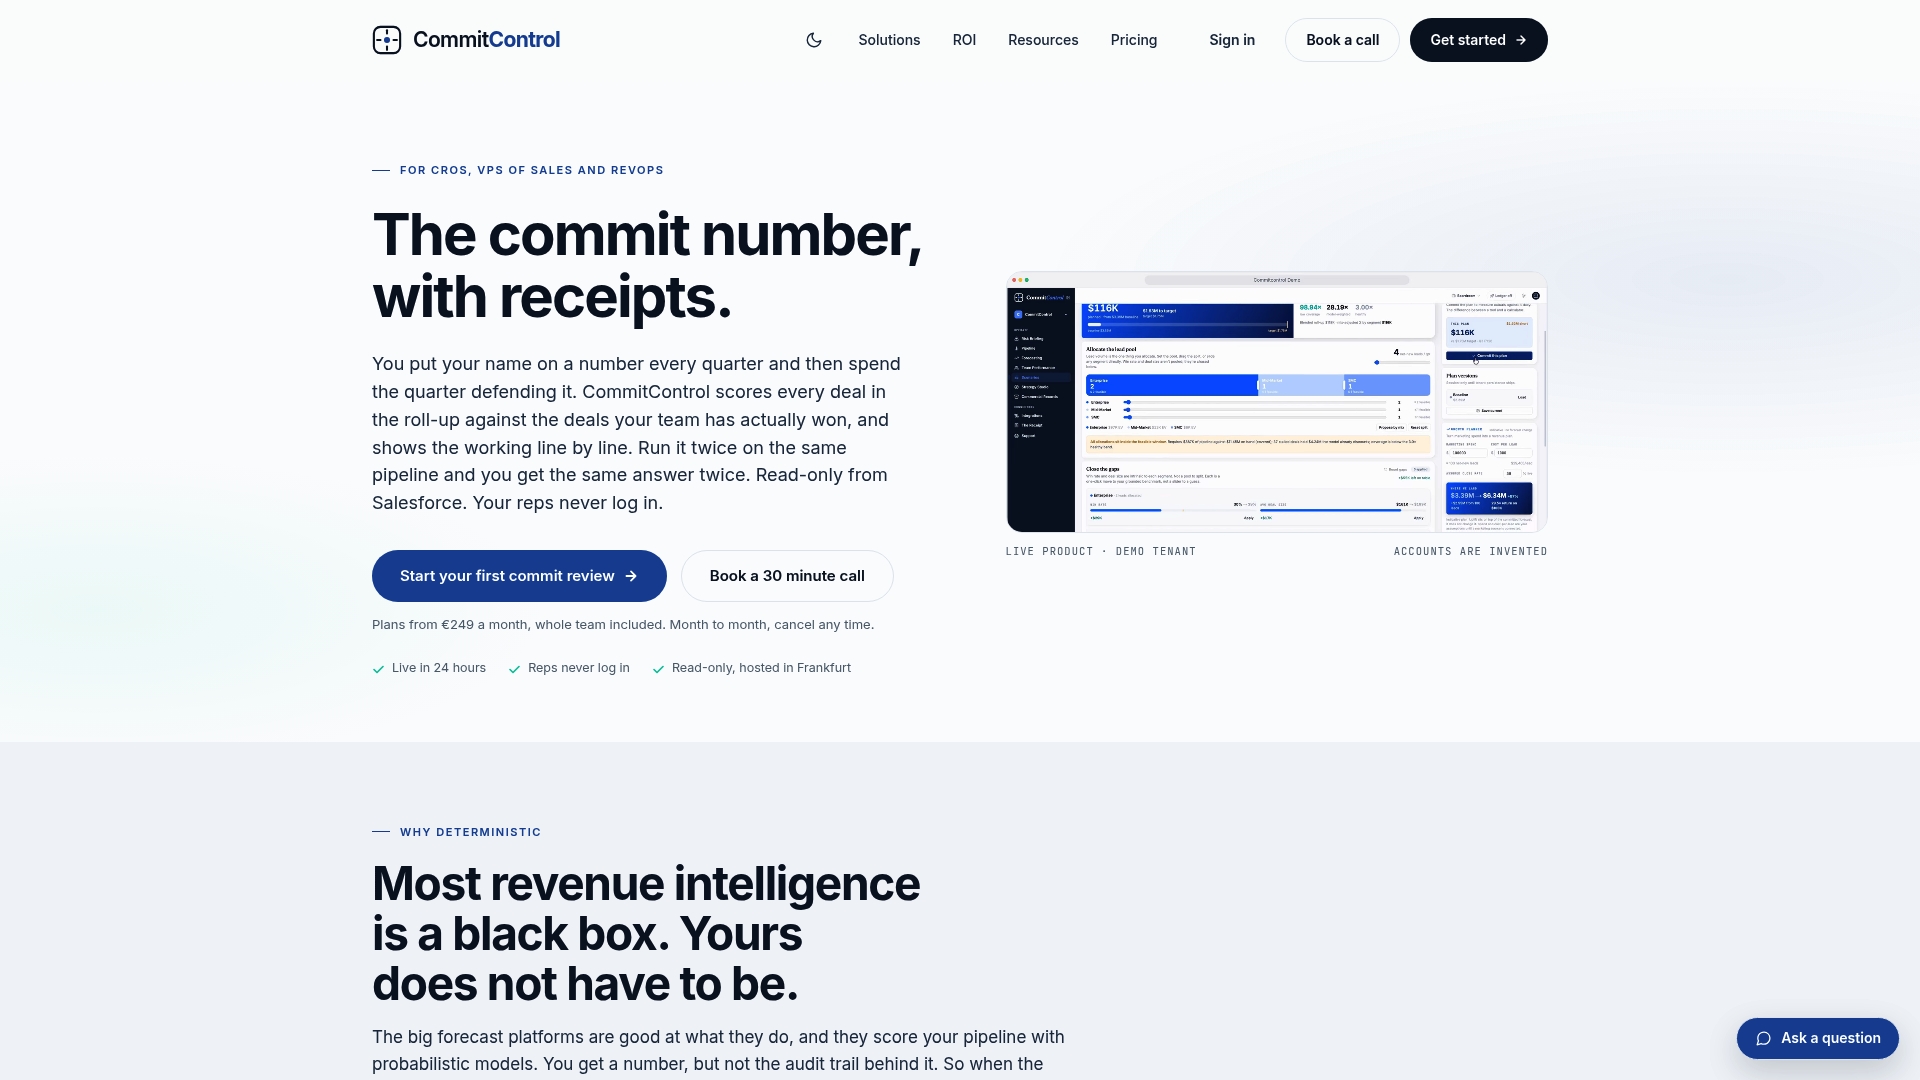
If forecast defence in front of the board has become a recurring headache, that’s usually a sign the process fix has run its course and the data layer itself needs attention. Run your numbers through the Sales Forecast Miss ROI Calculator to see what an inaccurate forecast is actually costing you, then check pricing for mid-market teams to see where Commitcontrol fits your evaluation.
Sources
For a deeper look at the formula and tracking methodology, the Metabase pipeline coverage metrics page is worth bookmarking alongside your own CRM reports. If your team is navigating a leadership change alongside a coverage reset, Commitcontrol’s guide to sales leadership transitions covers the operational side. Before trusting any coverage number, pull twelve months of closed-deal data to confirm your actual win rate and audit CRM hygiene. A ratio built on stale stage probabilities won’t survive its first board challenge.
- Pipeline Coverage: Definition, Formula & How to Track It in Metabase
- Pipeline coverage ratio: calculate (2026)
- Pipeline Coverage Ratio: How Much Pipeline Do You Need?
Recommended
Written with BabyLoveGrowth to create SEO content
See the same discipline applied to your pipeline.
CommitControl derives every figure from your own Salesforce data. Nothing is invented, and every number traces back to the record it came from. Connect Salesforce and the same view runs live on your data within 24 hours.
Evaluate CommitControl