Forecast variance analysis turns a missed number into a set of explainable drivers that leaders can act on, rather than a single accuracy score to defend or excuse. It pairs decomposition methods with error metrics like MAE and WAPE, and tools such as CommitControl now make the evidence trail behind each driver traceable back to Salesforce. The real value sits in the decomposition, not the headline miss.
TL;DR:
- Forecast variance decomposition reveals the true drivers behind misses, guiding targeted actions like pipeline process improvements or discount policy changes.
- Variance categories include volume, price, mix, timing, classification, and one-off events, each requiring specific management responses and driver tagging.
- Material variances should be flagged using thresholds, linked to assumptions, and backed by concrete evidence before identifying owners and solutions.
- Regular cadence—weekly, monthly, and quarterly—ensures variance analysis remains effective, with Salesforce data serving as the key evidence trail.
- Deterministic scoring tools built on Salesforce history provide transparent, repeatable forecasts, reducing surprises and increasing board confidence.
Table of Contents
- What forecast variance analysis is and why it matters
- Types of variances: a taxonomy for tagging what moved
- How to calculate forecast variance: formulas and sign rules
- Decomposing variance: from a miss to a documented driver
- Operational process: cadence, ownership and evidence trails
- Metrics and scorecard: which error measures actually help
- A practitioner example and what good evidence looks like
- Why driver-focused variance analysis is the control leaders actually need
- Get deterministic scoring instead of another black box
- Sources
- FAQ
What forecast variance analysis is and why it matters
A forecast called $1.2 million. Actuals landed significantly higher. That number alone tells a CRO nothing about what to fix. Forecast variance analysis is the discipline of breaking that gap into its component causes: timing, volume, price, mix, or a one-off event. It matters because two identical variance percentages can demand completely different responses.
A pipeline that closed late because a security review dragged on needs a process fix, not a headcount review. A pipeline that closed short because deals slipped stage after commit needs a governance fix on how commits get made. Aggregate accuracy is a symptom. The driver is the diagnosis, and variance analysis frameworks exist precisely because obsessing over the headline score conceals the intelligence gathering that actually changes decisions.
Two decisions this enables:
- A finance team spots that 80% of a quarterly miss traces to one enterprise renewal slipping two weeks. They hold headcount plans steady rather than cutting.
- A revenue leader sees a consistent price variance across three regions and renegotiates discount authority, instead of retraining the whole sales floor.
Types of variances: a taxonomy for tagging what moved
Every material gap between forecast and actual falls into one of six buckets. Tagging each line with a driver code, rather than leaving a blank “miss” cell, is what makes a variance report usable in a board meeting.
- Volume variance: fewer or more units, deals, or accounts than modelled. Response: revisit pipeline coverage ratios.
- Price variance: the same volume at a different rate or discount. Response: review discount approval limits.
- Mix variance: the total held but the composition shifted (more low-margin SKUs, more SMB deals). Response: check segment targets.
- Timing variance: the deal or revenue was real but landed in a different period. Response: adjust close-date discipline, not the annual plan.
- Classification variance: revenue booked to the wrong category, region, or product line. Response: fix the reporting rule, not the forecast.
- One-off variance: a genuine anomaly (a lawsuit settlement, a one-time contract). Response: exclude from trend analysis, log separately.
Kudwa’s driver-based reporting framework argues each of these six categories implies a distinct management action. Treat that as your minimum driver code list before your next variance meeting.
How to calculate forecast variance: formulas and sign rules
The arithmetic is simple. The discipline is in the conventions.
- Absolute variance = Actual − Forecast. A $500,000 shortfall on a $1.2 million forecast is stated as −$500,000, never as a bare “$500,000 miss” with the sign implied.
- Percentage variance = (Actual − Forecast) ÷ Forecast × 100. Some teams use the actual as the denominator instead. Pick one and state it, because the two produce different percentages on the same miss.
- Statistical variance of forecast error measures volatility across many forecast cycles, not a single period gap. It matters for safety stock, cash buffers, and any scenario where you need to know how wide the error band typically is, not just where it landed this quarter.
Two rules keep the numbers honest. First, freeze the forecast version before the period closes. If you let the “forecast” quietly update after actuals arrive, every variance number becomes retrospectively flattering. Second, keep the sign convention consistent across every report line so a negative always means the same thing, whether it is revenue, cost, or headcount.
For teams juggling multiple correlated drivers (interest rates, FX, demand shocks moving together), forecast error variance decomposition offers a statistical method for allocating error across those interacting variables, though most FP&A teams will not need it for a standard monthly review.
Decomposing variance: from a miss to a documented driver
A number without a driver is an opinion. Here is the workflow that turns it into evidence.
- Flag the material variance. Set a threshold (say, any line over 10% or $50,000) so small noise does not eat meeting time.
- Tag the driver. Use the six-category list above. If none fit cleanly, tag it “unknown” rather than forcing a weak explanation.
- Link it to the original assumption. Which line in the forecast model assumed the volume, price, or timing that turned out wrong?
- Attach evidence. A CRM close-date change, a signed contract, an FX rate. No driver tag survives a board meeting without a link a challenger can click.
- State the management implication and name an owner. Who acts, and by when?
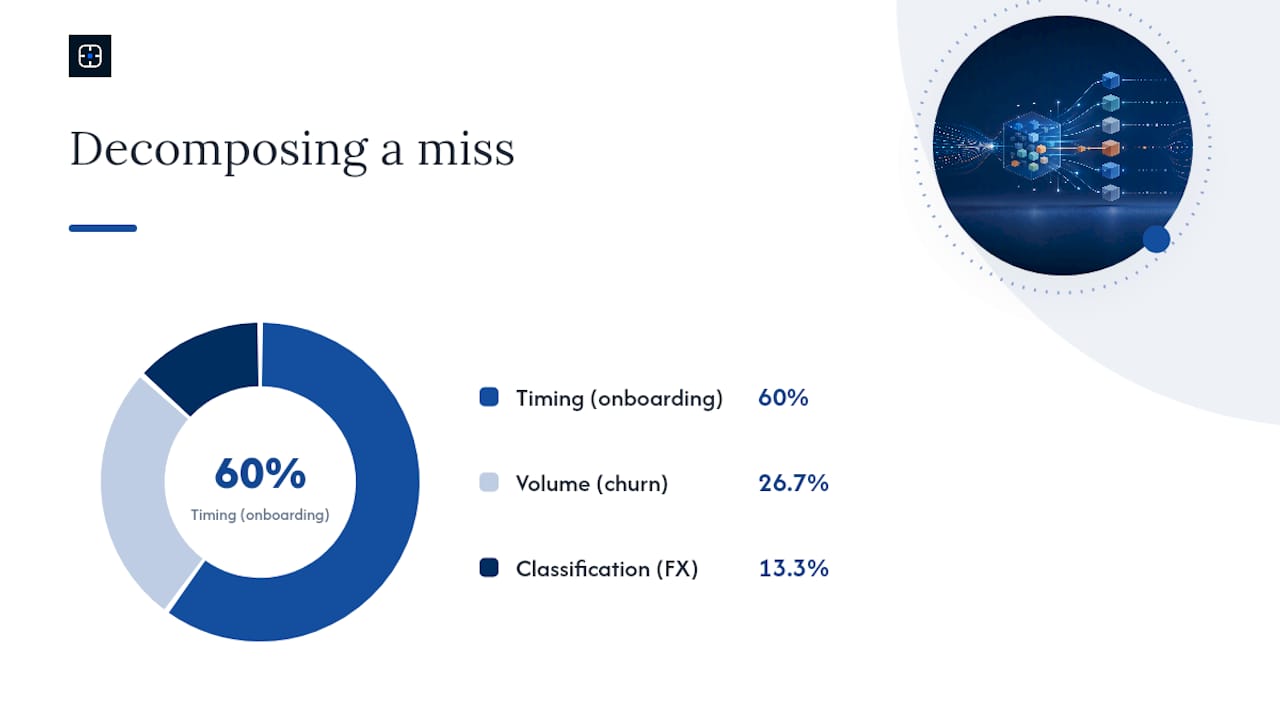
Mini example: a $300,000 revenue miss decomposes into $180,000 from onboarding delays pushing three deals into next quarter (timing), $80,000 from churn on a mid-market cohort (volume), and $40,000 from unfavourable FX on a European contract (classification, since the forecast was built in the wrong currency basis). Three drivers, three owners, three different fixes.
Pro Tip: Treat “unknown” as a legitimate interim tag, not a failure. A driver you cannot yet explain tells you exactly where to point your next investigation, which is more useful than a guess dressed up as certainty.
Operational process: cadence, ownership and evidence trails
Variance analysis fails when it is an annual exercise. It works when it is a rhythm.
- Weekly: check leading indicators (pipeline coverage, conversion rate, deal velocity). Weekly leading-indicator reviews give revenue teams four to eight weeks of runway to intervene before a miss shows up in closed revenue.
- Monthly: run the full decomposition on any material variance, with driver tags and evidence attached before the meeting starts, not during it.
- Quarterly: review the trend across drivers. Is timing variance recurring on the same deal type every quarter? That is a process problem, not bad luck.
Three roles keep this honest. The forecast owner commits to the number. The driver owner produces the tag and evidence for their line. The action owner commits to a change and a date. None of these should be the same person reviewing their own homework, and Salesforce data should back every tag, because self-reported explanations without a system-of-record link rarely survive a second questioning.
Metrics and scorecard: which error measures actually help
A single accuracy score hides more than it reveals, because over-forecasts and under-forecasts on different lines can cancel out and look like a clean forecast when nothing was clean about it. A proper scorecard pairs several measures.
- MAE (Mean Absolute Error): average size of the miss, in absolute terms, easy to explain to a board.
- WAPE (Weighted Absolute Percentage Error): size of the miss relative to volume, weighted so large accounts do not get drowned out by small ones.
- MAPE (Mean Absolute Percentage Error): simple percentage error, useful but distorted when actuals are near zero.
- Signed bias: whether the forecast consistently runs high or low. This is the number that catches systematic sandbagging or systematic overpromising.
- Coverage: how often the actual falls within a stated confidence band, useful for judging whether your uncertainty estimates are honest.
Pluvo’s FP&A scorecard approach recommends pairing a size metric with a direction metric and a baseline test, then freezing each forecast version so later corrections cannot be smuggled in retroactively. Score against a fixed horizon (always the number as it stood 30 days before period close, for example), never against whichever version happens to be most convenient in the room.
A practitioner example and what good evidence looks like
Consider a mid-market software company whose quarterly forecast called $2 million and landed at $2.6 million. On the surface, a “good” surprise. Decomposed, it was $450,000 of genuine new-logo growth, $200,000 pulled forward from next quarter by a renewal that closed early, and a small negative price variance from a discount campaign nobody had modelled. Three different actions followed: no headcount change, a warning flag on next quarter’s pipeline, and a review of discount authority.
That kind of decomposition depends on evidence that survives scrutiny, not a rep’s memory of what happened. Deterministic, auditable scoring, where every driver ties back to a Salesforce field rather than a black-box probability, is what makes that evidence defensible in a board meeting. Resetting the forecast during a sales leadership change is one of the moments this discipline matters most, because a new leader inherits assumptions nobody wrote down.
Why driver-focused variance analysis is the control leaders actually need
A CRO who reports “$400,000 of that was three deals slipping stage after commit, owned and being fixed” has told them everything. Aggregate accuracy scores and automated scoring tools can flag that a miss happened faster than a human would. They cannot replace a named owner and a traceable reason. Freeze your forecast versions, tag every material driver, and insist on evidence before the number reaches the board.
— Brian
Get deterministic scoring instead of another black box
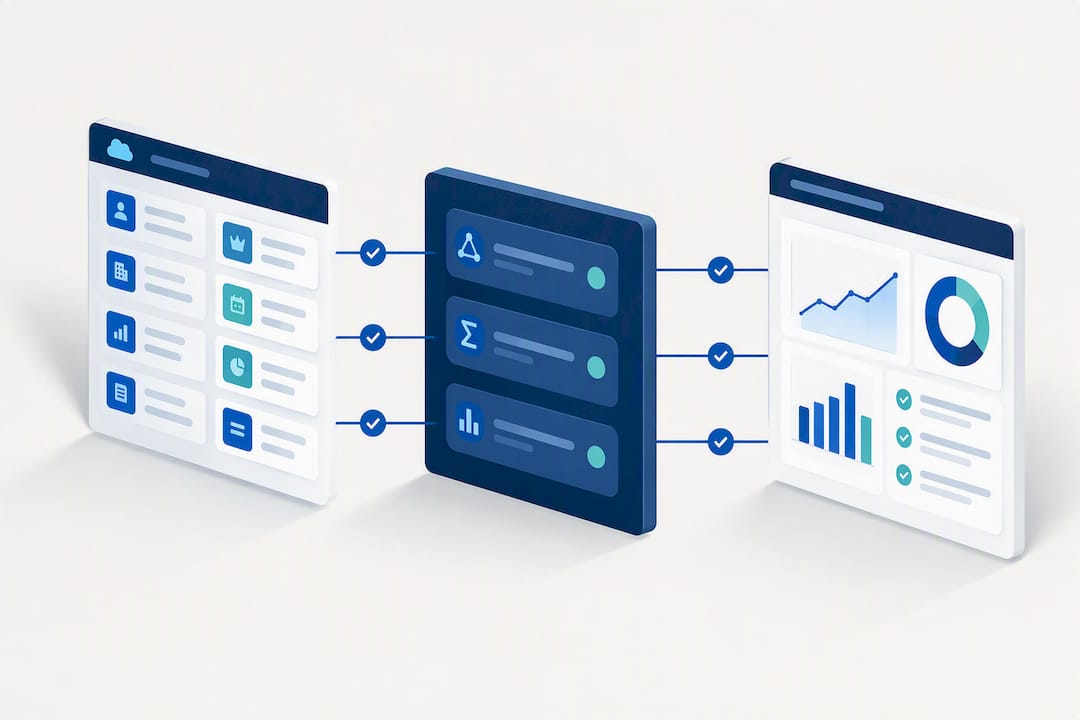
Most enterprise revenue tools score deals with models nobody in the room can fully explain, which is exactly why boards keep asking “how confident are we, really” and getting a shrug in response. CommitControl takes a different route: deterministic scoring built entirely on your own Salesforce history, with fixed logic and a readable evidence trail behind every number, so the same inputs always produce the same score and every driver traces back to a field you can point to.
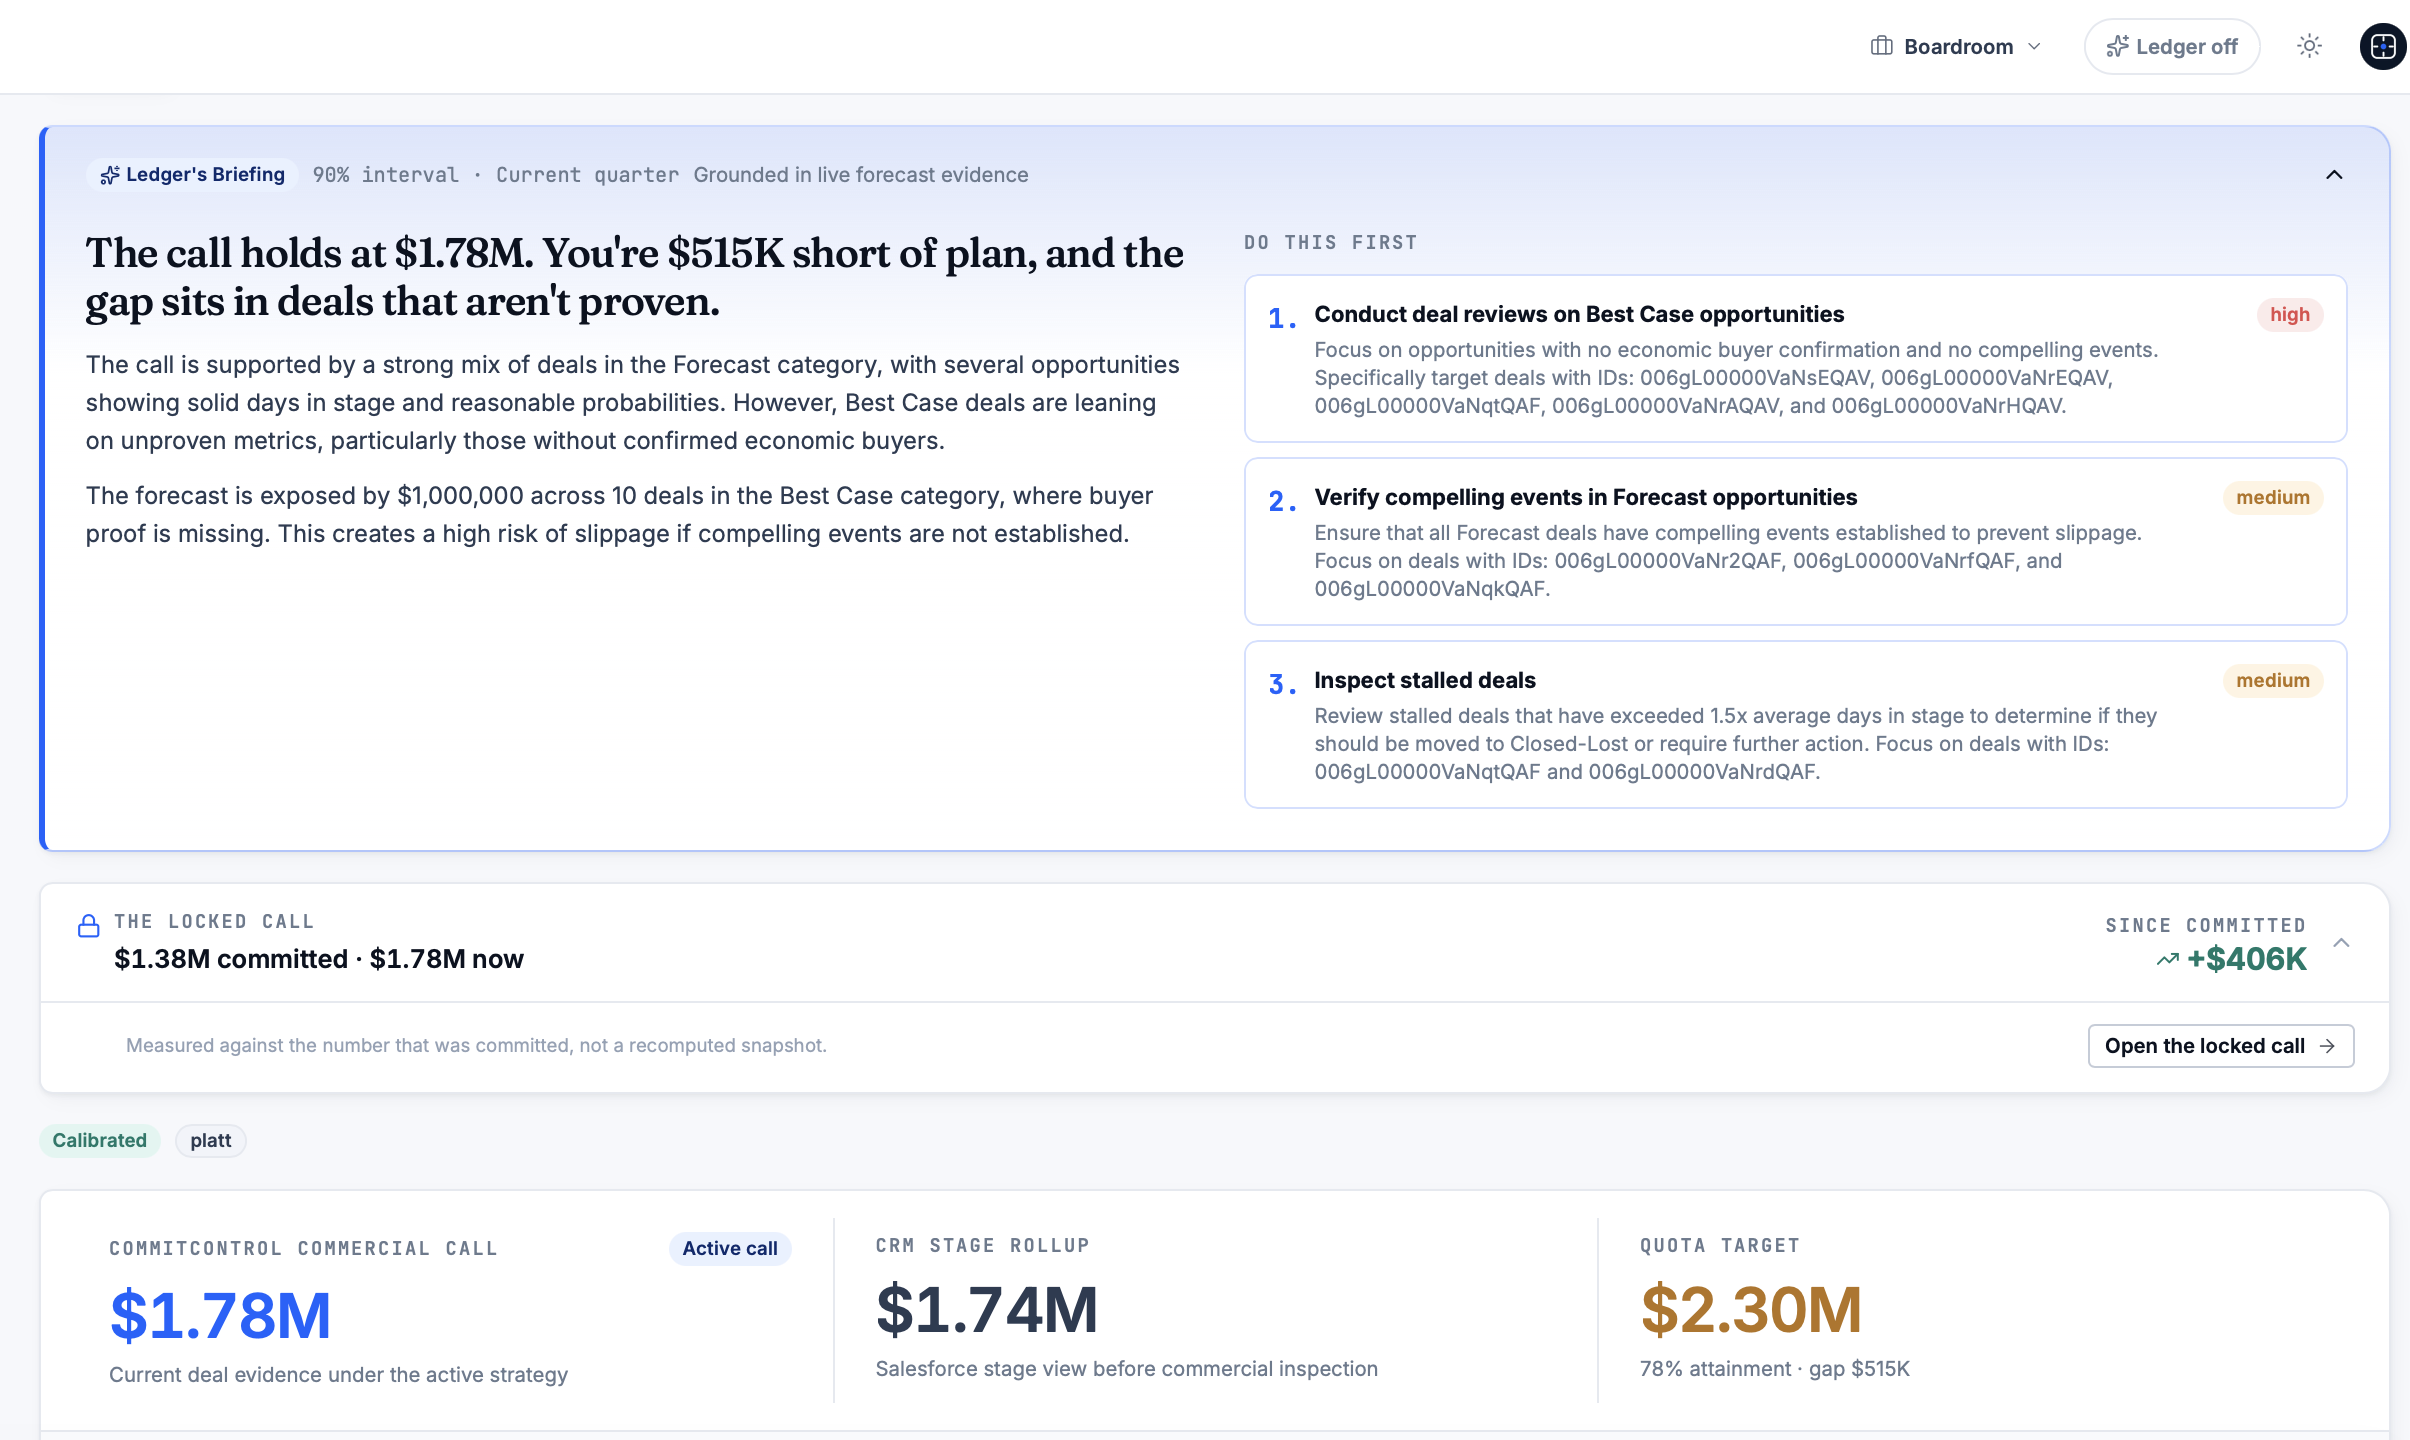
That means fewer surprises in the monthly review, forecast assumptions you can defend line by line, and a commit number you can actually stand behind in a board meeting. Plans run from Insight at €249 per month up to Command and Executive tiers, with Enterprise pricing available on request. If a forecast miss has cost you credibility this year, run the numbers through the ROI calculator and book a walkthrough to see the evidence trail on your own pipeline.
Sources
- Forecast vs actual reporting: why the variance matters less than the driver | Kudwa
- Forecast accuracy tracking: an FP&A scorecard | Pluvo
- Forecast accuracy | FP&A Trends
FAQ
What is a forecast variance?
A forecast variance is the gap between what a forecast predicted and what actually happened, expressed as an absolute figure or a percentage. On its own it only tells you something moved; decomposing it into a driver, such as timing, volume, price, or mix, tells you why and what to do about it.
What are the four main types of variance analysis?
Most FP&A frameworks group variances into volume, price, mix, and timing, though a fuller taxonomy adds classification and one-off categories to catch reporting errors and genuine anomalies. Each type points to a different fix: volume and price variances usually mean revisiting pipeline or discount rules, while timing variances mean tightening close-date discipline rather than changing the annual plan.
How do you work out forecast variance?
Subtract the forecast from the actual to get absolute variance, then divide by the forecast (or actual, if you choose that convention) and multiply by 100 for the percentage. Freeze the forecast version before comparing it to actuals, so the comparison stays honest and cannot be quietly revised after the fact.
What are the four types of forecasting?
Forecasting methods are commonly grouped into qualitative approaches (expert judgement), time series methods (trend and seasonality models), causal or econometric models, and, for more complex multi-variable systems, statistical decomposition techniques that allocate error across interacting drivers. Most finance teams use a blend rather than relying on one method alone.
What makes CommitControl different from other forecasting tools?
CommitControl scores deals deterministically using a customer’s own Salesforce history, so the same inputs always produce the same score and every driver is traceable rather than hidden inside a model. Plans start with Insight at €249 per month, scaling up through Command and Executive tiers for larger revenue teams.
Recommended
Editorial content. All metrics are Salesforce-derived and reviewed for accuracy. Not a substitute for professional judgment.
See the same discipline applied to your pipeline.
CommitControl derives every figure from your own Salesforce data. Nothing is invented, and every number traces back to the record it came from. Connect Salesforce and the same view runs live on your data within 24 hours.
Evaluate CommitControl