Your team forecast £1.2 million for the quarter. You closed £1.0 million. That £200,000 gap did not appear by accident: it is forecast bias, the consistent, directional gap between what your pipeline says and what your bank account confirms. Left unmeasured, it repeats every quarter in the same direction. Fixing it takes measurement, not more optimism: a formula, a segmentation, and a governance process that makes accurate forecasting the rewarded behaviour rather than the punished one.
TL;DR:
- Most forecast bias originates from human adjustments, such as sales overlays and incentive effects, rather than statistical model errors.
- Segment-level bias analysis and tracking signals help detect whether bias is a short-term fluctuation or a persistent process issue.
- Fixing forecast bias requires organizational change, including stage gate discipline, bias logging, and altering incentive structures to reward accuracy.
- Deterministic scoring models that trace forecasts back to CRM inputs improve auditability and prevent informal, untraceable bias adjustments.
- Monitoring cadence should include monthly drift checks and quarterly reviews, with dashboards highlighting segment trends and trigger alerts for persistent bias.
Table of Contents
- What is forecast bias and how does it differ from forecast accuracy?
- How do you calculate bias in forecasting?
- Where does forecast bias usually come from?
- Diagnosing bias: an operational checklist
- Practical mitigation: governance, process and technical fixes
- Monitoring cadence and acceptable benchmark ranges
- Deterministic forecasting and evidence trails: a first-hand view
- Impact of forecast bias on business decisions and financial performance
- Examples of forecast bias in different industries
- Human judgment versus statistical models: who is really biasing the forecast?
- Advanced techniques: what machine learning actually adds here
- Tools and software for monitoring forecast bias
- Fix the incentives before you buy a model
- Building a forecast the board does not discount
- Sources
- FAQ
What is forecast bias and how does it differ from forecast accuracy?
Forecast bias is the tendency of a forecast to consistently overshoot or undershoot the actual result. Forecast bias is defined by its direction, not its size: a forecast can be wildly inaccurate on any single deal yet unbiased overall, because the errors cancel out. Bias is what remains after the noise cancels and a pattern stays.
Consider a rep who forecasts five deals at £100,000 each. Three close, two slip. The rep’s per deal accuracy was poor: two guesses were flatly wrong. That is bias, and it is predictable enough to correct for in advance.
This distinction matters because accuracy and bias require different fixes. Accuracy problems mean your inputs are noisy: bad data, volatile markets, inexperienced reps guessing. Bias means your process has a built-in lean, usually towards optimism. You can improve accuracy by adding more signal. You fix bias by finding where the lean comes from and removing it.
Related terms show up interchangeably in planning meetings, and precision here saves arguments later:
- Forecasting error is the raw difference between forecast and actual for a single period, unsigned.
- Bias in predictions refers to the systematic component of that error across many periods.
- Sandbagging is deliberate negative bias, usually by reps protecting themselves against a miss.
- Forecast accuracy issues is the broader umbrella that includes both bias and pure noise.
Call it by its correct name in board reporting.
How do you calculate bias in forecasting?
Three numbers do most of the work: mean forecast error, percentage bias, and the tracking signal. None of them require specialist software. A spreadsheet and four quarters of history will get you a defensible answer.
Mean Forecast Error (MFE) is the average of (Actual minus Forecast) across periods. A consistently negative MFE means you are over-forecasting. A consistently positive MFE means you are under-forecasting and probably sitting on capacity you are not using.
Percentage bias converts that raw number into something comparable across SKUs, teams, or deal sizes:
Percentage Bias = (Sum of Actuals minus Sum of Forecasts) / Sum of Forecasts × 100
A £50,000 miss on a £5 million book is trivial. The same miss on a £500,000 book is not. Percentage bias lets you rank teams and products on the same scale, which raw error cannot do.
Tracking signal is the metric that tells you whether a bias is a blip or a trend. It is calculated as cumulative forecast error divided by the mean absolute deviation (MAD) of that error. Tracking signal is a standard forecast error monitoring tool used across supply chain and demand planning functions to flag when a forecast has drifted outside acceptable control limits.
A worked example, using four quarters of a mid-market SaaS pipeline:
- Forecasts: £1.2m, £1.3m, £1.15m, £1.4m. Actuals: £1.0m, £1.05m, £0.95m, £1.1m.
- Errors (Actual minus Forecast): −£200k, −£250k, −£200k, −£300k.
- MFE: −£237,500. Consistently negative across all four periods, which is the signature of bias rather than noise.
- Percentage bias: (−950,000) / 5,050,000 × 100 indicates a material, sustained over-forecast.
- Tracking signal: cumulative error (−£950,000) divided by MAD (£237,500) = −4.0. This value is widely treated by practitioners as a strong signal to investigate immediately.
Pro Tip: Run this calculation on a rolling 4 to 6 cycle window, not a single quarter. One bad quarter is noise. Four bad quarters in the same direction is a process problem, and the tracking signal will tell you which one you are looking at before your CFO does.
Where does forecast bias usually come from?
Bias rarely comes from the statistical model. It comes from what happens to the model’s output after a human touches it. Four sources account for most of what shows up in a bias audit.
- Sales overlays and incentive effects: reps and managers adjust the raw pipeline number up to hit quota optics or down to protect against a miss. Industry guidance consistently points to sales overlays and incentive structures as the most common source of forecast bias, more so than the underlying statistical baseline.
- Data issues and one-off events: a single enterprise deal, a pandemic-era spike, or a data entry error gets baked into historical training data and skews every projection built on top of it.
- Trend extrapolation and structural change: a model trained on last year’s growth curve assumes that curve continues, even after a market shift, a pricing change, or a competitor’s entry breaks the trend.
- Concentration effects: bias is rarely evenly spread. It clusters by rep (the optimists versus the sandbaggers), by stage (deals that stall right after moving to “Commit”), by product line, or by channel.
Academic work on prediction systems backs up the concentration point in a wider context: sampling bias in training data propagates directly into model outputs, and it becomes detectable only when you audit at the segment level rather than the aggregate. Average them out and you fix nothing.
Diagnosing bias: an operational checklist
Finding where bias enters the forecast is a sequence, not a single calculation. Skip a step and you will fix the wrong layer.
- Compare the statistical baseline to the consensus number. Run your unadjusted model output against the number that actually goes to the board. If the baseline is close to unbiased and the consensus is not, the overlay, meaning human adjustment, is your problem. This is the diagnostic industry guides recommend first: fix the overlay before you touch the model.
- Segment bias by SKU, rep cohort, and pipeline stage. Calculate percentage bias for each segment separately. A company average near zero with wild segment-level swings means you have several distinct problems wearing one disguise.
- Compute the tracking signal for each segment and watch the trend. A segment sitting at a tracking signal of ±2 for one quarter is watching territory. The same segment at ±2 for four consecutive quarters is a governance failure.
- Prioritise fixes by impact and feasibility. Rank segments by revenue exposure multiplied by bias severity. Fix the rep cohort costing you £400,000 a quarter before the one costing £40,000, even if the smaller one is an easier conversation.
Pro Tip: *If your statistical baseline is clean but your consensus number is not, do not retrain the model.
Segmentation is not optional here. Cohort-level review by rep, team, and product is the practical way to design a targeted fix rather than applying a blunt, company-wide haircut that penalises accurate forecasters alongside the biased ones.
Practical mitigation: governance, process and technical fixes
Bias is a process failure before it is a data failure, which means most of the fix is organisational, not technical.
Start with stage gates. Document the exact qualification criteria a deal must meet before it moves to “Commit” or “Best Case”, and enforce them consistently. Deals that slip immediately after a stage change are usually evidence that the gate was opened on hope rather than evidence.
Publish bias numbers, not just accuracy numbers, to reps and their managers on a rolling basis. A rep who knows their personal bias score is visible behaves differently from one who only sees a pass or fail on quota.
- Replace informal “haircuts” with an explicit, logged adjustment rule: who adjusted the number, by how much, and why.
- Decide upfront when a bias episode warrants retraining the baseline model versus when it warrants fixing the input data or the incentive that caused it.
- Exclude genuine one-off events (a single outsized deal, a data migration error) from the baseline training set rather than letting them permanently skew the trend line.
- Change what you reward. If commission or recognition rewards optimistic forecasting over accurate forecasting, no amount of dashboard tooling will fix the behaviour underneath it.
Pro Tip: A four-step correction loop works well in practice: measure the bias, identify its source through segmentation, apply a targeted correction at that specific layer, then re-measure next cycle to confirm it held. Skipping the re-measurement step is the most common reason bias fixes quietly reverse within two quarters.
None of this requires new software to start. It requires someone with authority to say that a rep’s forecast being wrong in the same direction every quarter is a performance issue, not a rounding error.
Monitoring cadence and acceptable benchmark ranges
A bias figure without a review cadence is a one-off diagnosis, not a management system. Most functioning forecast governance runs on two clocks: monthly operational checks to catch drift early, and a deeper quarterly review to decide whether structural changes are needed.
Local judgement matters here: a volatile, project-based business unit will tolerate a wider band than a subscription business with predictable renewal cycles.
A dashboard built for this should show three things, no more:
- Cohort views by rep, product, and stage, because a healthy average can hide an unhealthy segment.
- Tracking signal alerts that flag automatically when a segment crosses a control limit, rather than requiring someone to remember to check.
- Historical trend lines, not single-period snapshots, because bias is defined by persistence over time.
Translate the number into an action, not just a report. A dashboard that flags the number without prompting the question is decoration, not governance.
Deterministic forecasting and evidence trails: a first-hand view
Deterministic scoring means the same inputs always produce gets the same score, and every input traces back to something in Salesforce: a stage change, a committed date, a missing purchase order. There is no hidden weighting a rep can argue with because there is nothing hidden. A deterministic evidence trail maps each assumption to CRM evidence, so when a number moves, you can show exactly which fact moved it and who owns that assumption.
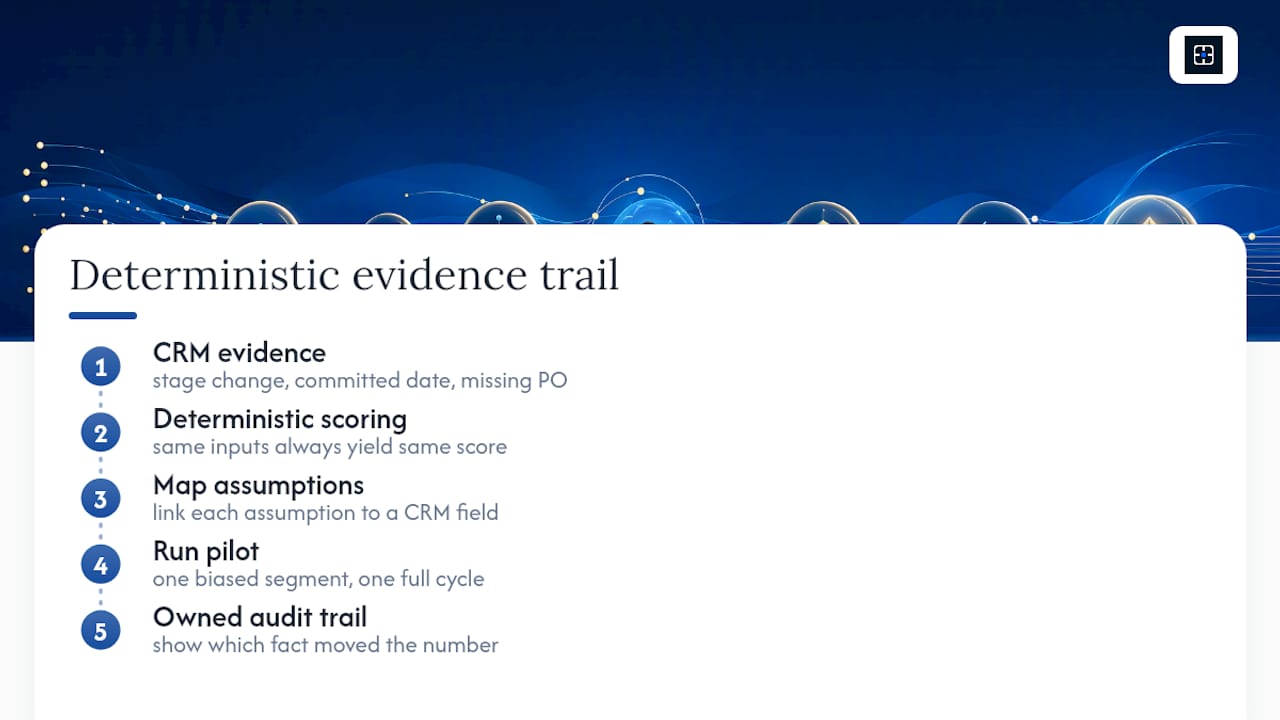
This matters directly for bias reduction, because it replaces informal haircuts with a documented, defendable trail. If you want to pilot this approach, start narrow: pick one segment with known bias history, map its assumptions to CRM fields, and run it alongside your existing forecast for one full cycle before switching over.
Impact of forecast bias on business decisions and financial performance
Bias does not stay contained to the forecasting meeting. It moves straight into decisions that cost real money.
Persistent over-forecasting drives excess inventory, over-hiring ahead of revenue that never arrives, and board commitments the business cannot meet. Persistent under-forecasting has the opposite cost profile: it leaves capacity idle, causes companies to under-invest in production or hiring, and leaves revenue on the table because nobody planned for the upside.
The financial reporting consequence is arguably worse than either operational cost. A CFO who builds a board narrative on a biased number is exposed the moment reality diverges, and that exposure erodes trust in every subsequent forecast the function produces, whether or not the next one is accurate. Investors and boards do not punish a single miss nearly as harshly as they punish a pattern: one bad quarter is explained, four biased quarters in the same direction gets a leadership team replaced.
There is a compounding effect too. Once a forecast has a known bias, every downstream plan built on it, cash flow projections, hiring plans, inventory commitments, inherits that bias.
Examples of forecast bias in different industries
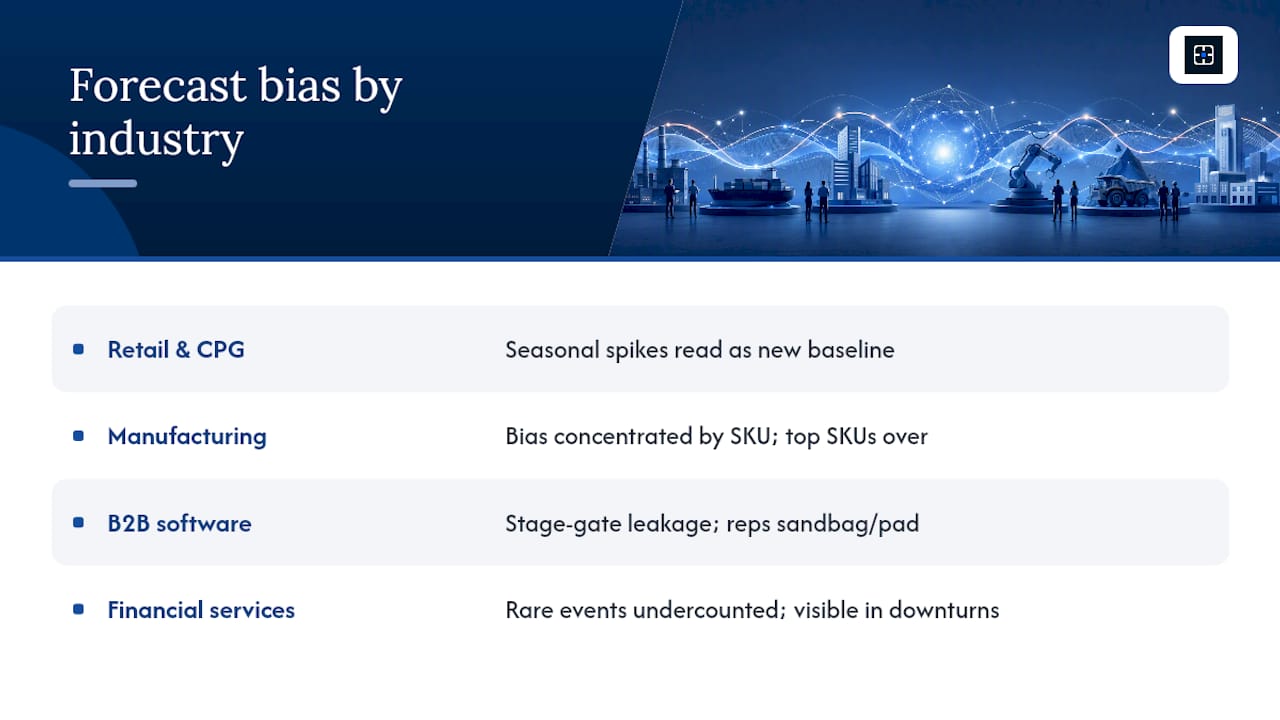
Retail and consumer goods planners see bias most often as trend mis-specification: a model trained on a strong holiday season extrapolates that growth rate forward and consistently over-forecasts the following quarter, because seasonal spikes get read as a new baseline rather than a temporary event.
Manufacturing and industrial supply chains tend to show bias concentrated by SKU rather than by time period. A handful of high-volume products carry systematic over-forecasting because sales teams push for safety stock, while long-tail products are consistently under-forecast because nobody wants to spend planning time on low-revenue lines.
B2B software and subscription businesses show the pattern this article opened with: sales pipeline bias driven by stage-gate leakage, where deals get marked “Commit” before they meet the qualification bar, and by rep-level sandbagging or padding depending on how commission plans are structured.
Financial services forecasting, particularly credit and default modelling, faces a different flavour entirely: bias introduced through historical data that under-represents rare but severe events, meaning the bias only becomes visible during a downturn, long after the model was built and trusted.
The common thread across all four: bias is invisible in an aggregate number and obvious the moment you segment. Whatever industry you sit in, the fix starts with the same question: which cohort, product, or time period is carrying the lean that the average is hiding.
Human judgment versus statistical models: who is really biasing the forecast?
The instinct is to blame the model. The evidence usually points the other way. When a statistical baseline is unbiased but the consensus forecast is not, the human overlay is the source, not the underlying statistics.
Human judgement adds real value to forecasting: reps know about a competitor’s pricing move or a champion who just left the buying company before any model does. The problem is not that humans adjust forecasts. The problem is that those adjustments are usually informal, undocumented, and directionally consistent with whatever protects the adjuster, whether that is a rep protecting against a miss or a manager protecting a board narrative.
Statistical models have their own failure mode: they are only as good as the trend they were trained on, and they cannot see a structural market shift coming. A pure statistical forecast during a genuine demand shock will be confidently, precisely wrong.
The practical answer is not choosing one over the other. It is making every human adjustment as visible and auditable as the statistical baseline underneath it: logged, attributed to a named owner, and measured for its own bias contribution over time. An adjustment nobody can trace back to a reason is exactly where sandbagging and padding hide.
Advanced techniques: what machine learning actually adds here
Machine learning approaches to bias reduction generally fall into two useful categories: better baseline models that adapt faster to structural change, and automated bias detection that flags drift before a human would notice it in a spreadsheet.
The genuine value is speed of detection, not magic accuracy. A well-built anomaly detection layer can flag that a rep cohort’s bias has crossed a tracking signal threshold within days rather than waiting for the quarterly review to surface it. That earlier flag is worth more than a marginal improvement in raw forecast precision, because it gives you time to intervene before the bias compounds across a full cycle.
Be sceptical of vendors who lead with a black-box accuracy claim and cannot show you which specific input drove which specific score. A model that improves accuracy by a few points but cannot explain a single prediction to a board is not solving the governance problem this article has been describing: it is just a more sophisticated way to produce a number nobody can defend under questioning. If a tool cannot trace a score back to a concrete, auditable fact in your CRM, treat its accuracy claims with the same scepticism you would apply to an unaudited human forecast.
The realistic advanced technique for most mid-market teams is not a bespoke model. It is disciplined, automated bias monitoring layered on top of the CRM data you already have, applied consistently at the cohort level described earlier in this article.
Tools and software for monitoring forecast bias
Most teams start with what they already have: a spreadsheet running the MFE and tracking signal calculations described earlier, refreshed monthly. This works fine at low volume and is the right starting point before buying anything.
Business intelligence platforms such as Power BI or Tableau handle the dashboard layer well once you have more than a handful of segments to track, letting you build the cohort views and trend lines a governance process needs without custom development.
Purpose-built revenue forecasting platforms sit above that layer. Some rely on probabilistic scoring that produces a confidence percentage without a clear trail back to the input that generated it, which makes the number hard to defend in a board meeting when someone asks why it changed. Others, including CommitControl, use deterministic scoring, meaning the same CRM inputs always generate the same score and every score traces back to a specific field, stage, or date in Salesforce. The choice between these approaches usually comes down to one question: when your forecast moves, do you need to explain exactly why, to a board or a CFO, in a way that survives scrutiny?
Fix the incentives before you buy a model
Most forecast bias is not a modelling problem. It is an incentive problem wearing a spreadsheet. Reps pad or sandbag because the organisation rewards the appearance of hitting quota over the discipline of forecasting it accurately, and no amount of statistical sophistication changes that underlying behaviour.
Tooling earns its budget once governance is already in place: once stage gates are enforced and adjustments are logged, better monitoring genuinely accelerates detection. Buy the tool before fixing the incentive and you have built an expensive dashboard that watches the same bad behaviour happen faster.
The return on making bias visible is straightforward. A board that trusts your number stops discounting it, and that trust is worth more than any single quarter’s accuracy.
— Brian
Building a forecast the board does not discount
The three options most revenue leaders compare here are a spreadsheet built in house, a probabilistic forecasting platform, and a deterministic one. The spreadsheet is honest but slow, and it breaks down the moment you need to segment bias across more than a few cohorts. Enterprise tools with probabilistic scoring can be fast, but many rely on models that produce a confidence number without a traceable reason behind it, which leaves you defending a score you cannot fully explain when a board member asks why it moved.
Commitcontrol takes the deterministic route instead: the same Salesforce inputs always produce gets the same score, every signal traces back to a specific field, stage, or date, and one person owns each adjustment. There is no rep workflow to relearn and no black box to trust on faith.
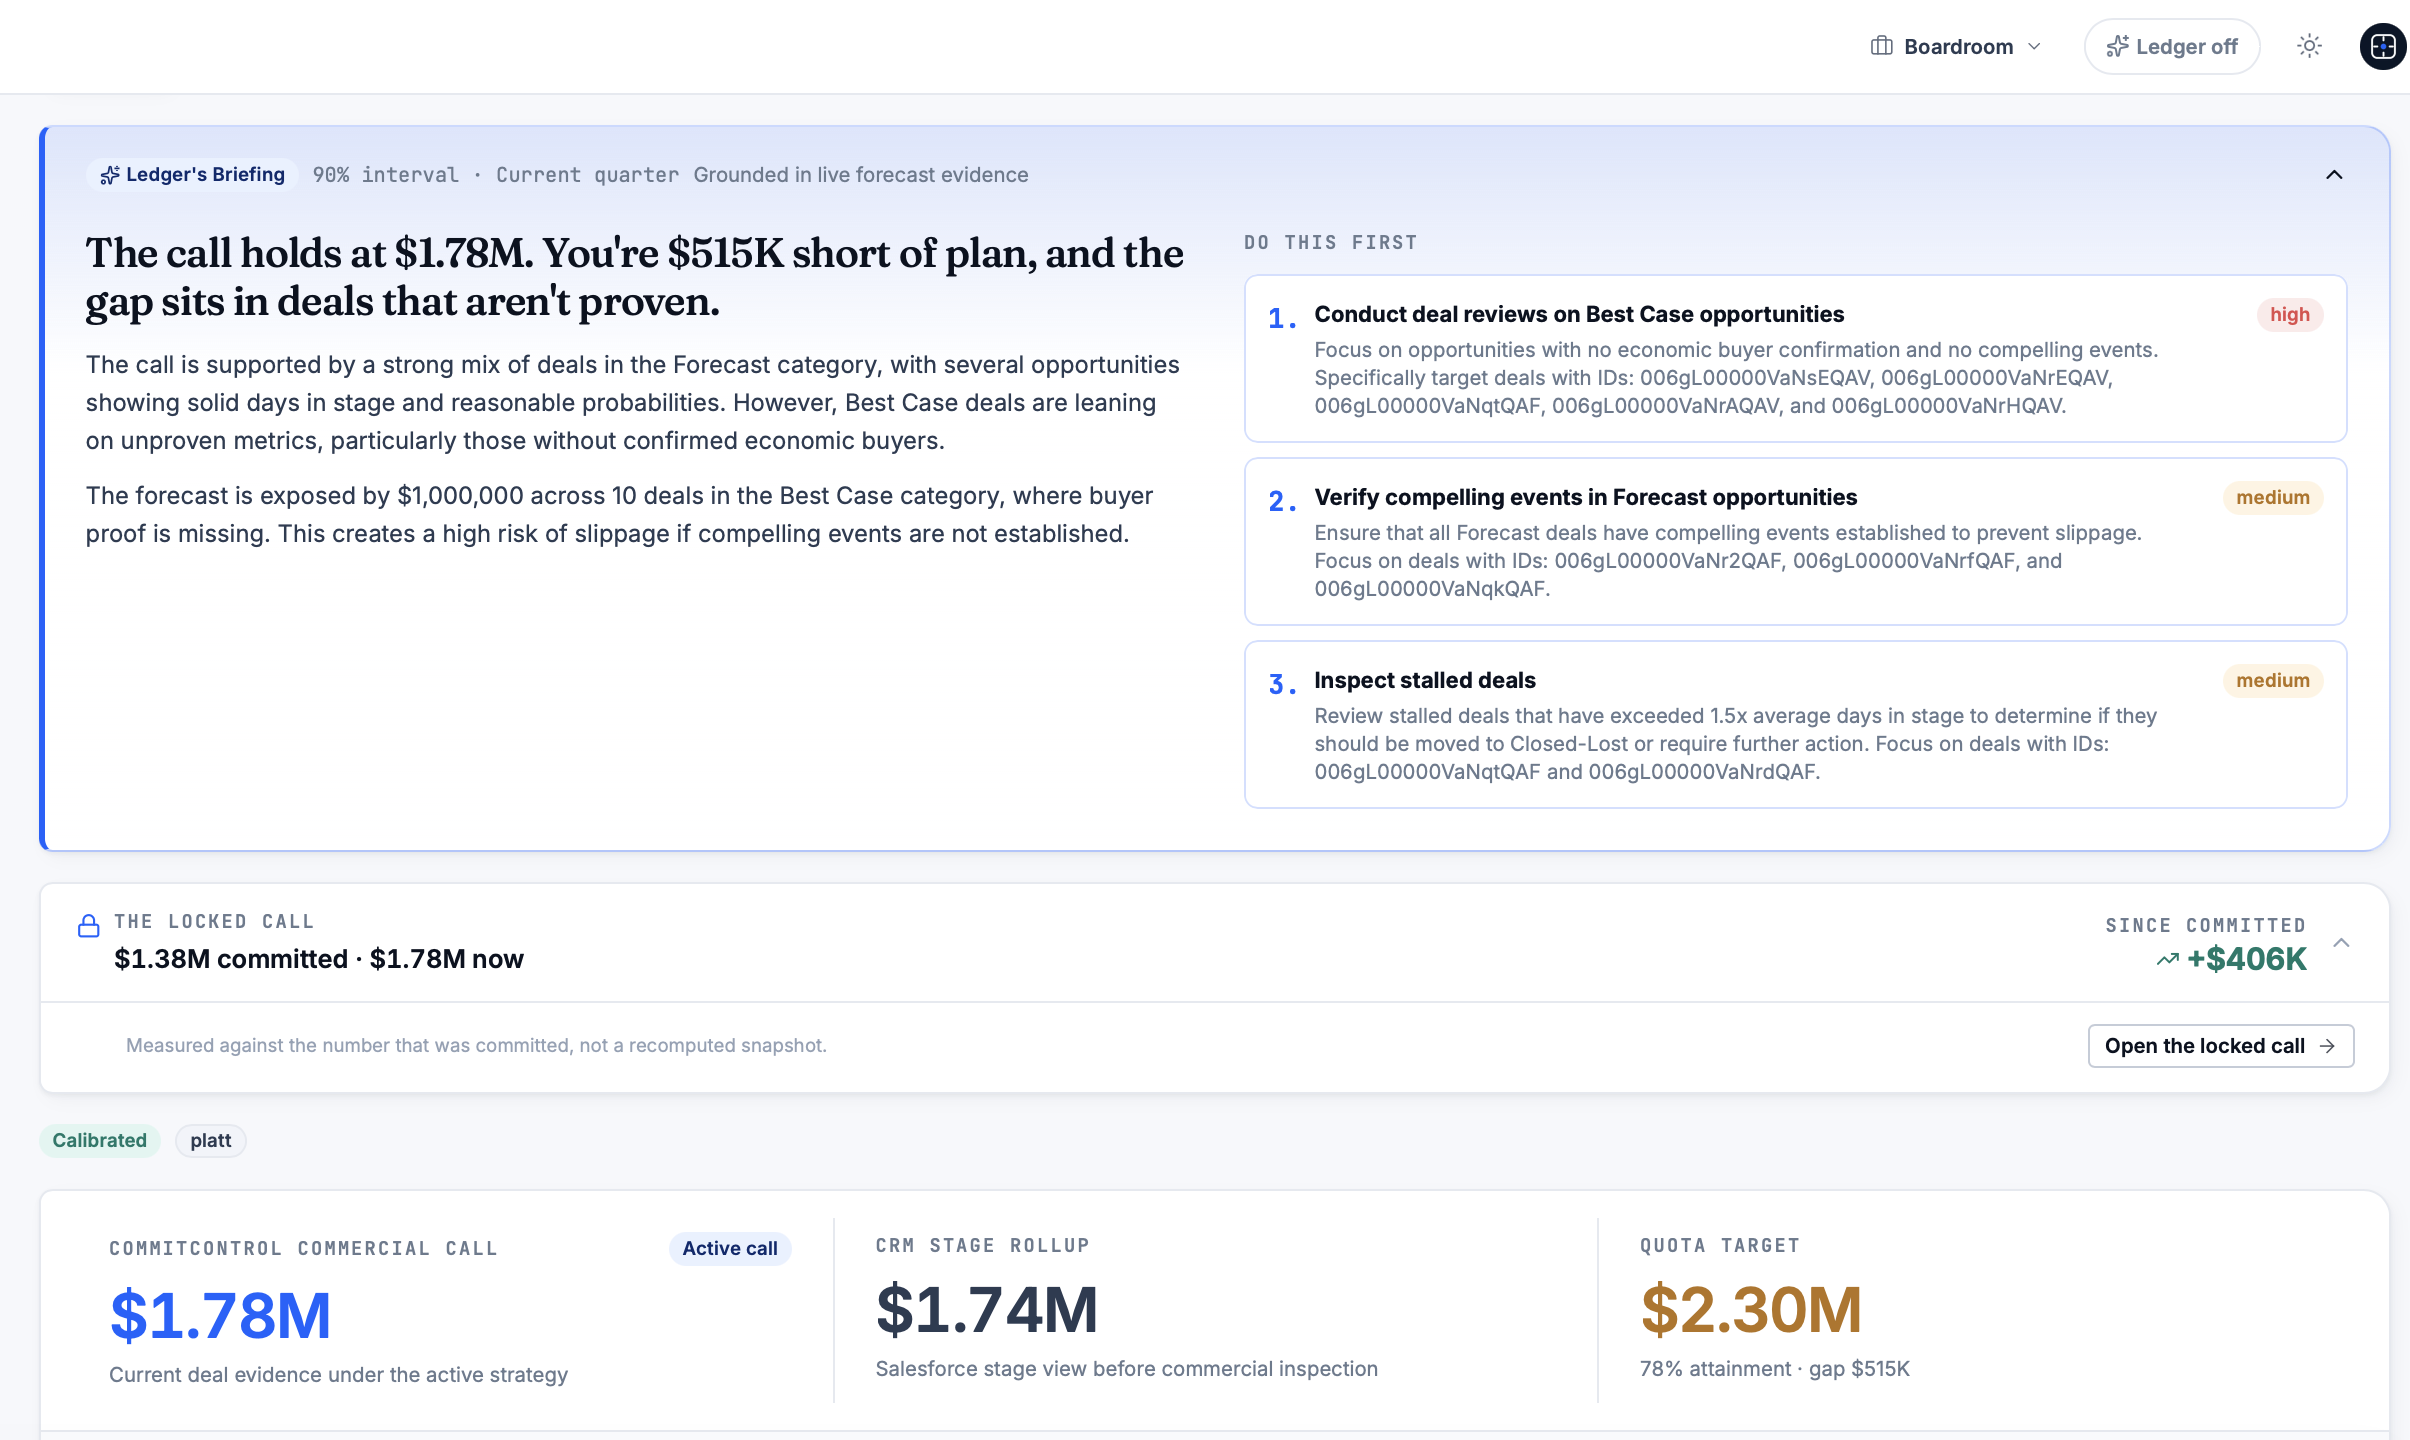
That matters most in exactly the scenario this article opened with: a forecast that runs biased for several quarters and a leadership team that needs to reset it credibly. Commitcontrol’s sales leadership transition offering is built for that reset, giving incoming revenue leaders an auditable starting point instead of inherited guesswork. If you want to see what a persistent bias pattern is actually costing your business, run the numbers through the forecast miss ROI calculator, then book a walkthrough of the full platform to see how a deterministic commit number holds up under board questioning.
Sources
- Forecast bias — Wikipedia
- AAAI paper on propagation and detection of sampling bias
- Forecast bias — Fairview
FAQ
What are the four types of forecasting?
Forecasting methods are generally grouped into qualitative (expert judgement, sales rep input), time series (trend and seasonality extrapolation), causal or econometric (modelling demand drivers), and simulation-based methods, with most mature B2B sales forecasts blending a statistical baseline with a human consensus overlay.
How do you calculate bias in forecasting?
Calculate Mean Forecast Error as the average of Actual minus Forecast across periods, then express it as percentage bias using (Sum of Actuals minus Sum of Forecasts) divided by Sum of Forecasts. The tracking signal, cumulative error divided by mean absolute deviation, tells you whether that bias is persistent enough to act on.
What is the difference between forecast accuracy and bias?
Accuracy measures how close a forecast is to actual results regardless of direction, while bias measures the consistent directional error, meaning a forecast can be inaccurate on individual deals yet remain unbiased overall if the errors cancel out over time.
What is positive bias in forecasting?
Positive bias means actuals consistently exceed forecasts, so the business is under-forecasting demand or revenue, which typically shows up as under-staffed teams, stockouts, or unplanned upside that nobody budgeted resources to capture.
Can a deterministic scoring approach reduce forecast bias?
Yes, because tying every score to a specific, traceable CRM input removes the informal adjustments and undocumented haircuts that are the most common source of bias, replacing guesswork with an auditable trail a board can question directly.
Recommended
Editorial content. All metrics are Salesforce-derived and reviewed for accuracy. Not a substitute for professional judgment.
See the same discipline applied to your pipeline.
CommitControl derives every figure from your own Salesforce data. Nothing is invented, and every number traces back to the record it came from. Connect Salesforce and the same view runs live on your data within 24 hours.
Evaluate CommitControl