Forecast accuracy is 1 minus your forecast error, calculated using a standard formula such as MAE, RMSE, MAPE or WMAPE depending on what you’re measuring. Each formula answers a different question. WMAPE tells the board how far off you were in real revenue terms. MAE tells planners how many units they missed by. RMSE flags the one catastrophic miss hiding inside an otherwise decent average. Whichever you report, state the grain and the horizon: “SKU/week” or “deal/quarter” is not optional detail. It’s the difference between a number and a claim.
TL;DR:
- Using the correct error metric depends on your decision context; WMAPE is best for revenue-focused reporting, while MAE suits planning needs.
- Zero-actual periods can distort MAPE calculations, so switching to MAE or scaled errors provides more reliable forecasts in those cases.
- Combining multiple forecast methods and testing against naive baselines can significantly reduce prediction errors for better accuracy.
- Traceable, deterministic scoring linked directly to Salesforce data ensures forecasts can be explained and verified step-by-step.
- Always specify the grain and horizon when reporting forecast accuracy to ensure the numbers inform the correct level of decision-making.
Table of Contents
- The forecast accuracy formula and why the wrong one misleads
- Core formulas and exact Excel expressions
- How to build a forecast accuracy check in Excel
- Which formula to use for which decision
- What accuracy numbers actually hide, and what to do about it
- Why traceable scoring makes accuracy numbers defensible
- What VPs and CROs should demand before trusting any accuracy figure
- A practical option if you’re tired of defending numbers you can’t explain
- Sources
- FAQ
The forecast accuracy formula and why the wrong one misleads
A forecast called for £1.2 million. The quarter landed at £1.7 million. Was that a good forecast? The honest answer depends entirely on which formula you use to answer, and at what grain.
This is the trap most sales teams fall into. A commit number gets reported as a single figure, without stating whether it’s measured deal by deal, rep by rep, or at the portfolio level. Without that context, “forecast accuracy” is close to meaningless.
The formulas below are not new. They come from decades of statistical forecasting practice, documented in standard references such as Rob Hyndman’s work on forecast accuracy and the textbook Forecasting: Principles and Practice. What’s missing in most sales organisations isn’t the maths. It’s the discipline to apply the right formula to the right question, and to be honest about what it shows.
Core formulas and exact Excel expressions
Four formulas cover almost every forecasting question a revenue leader needs answered. Each has a specific job.
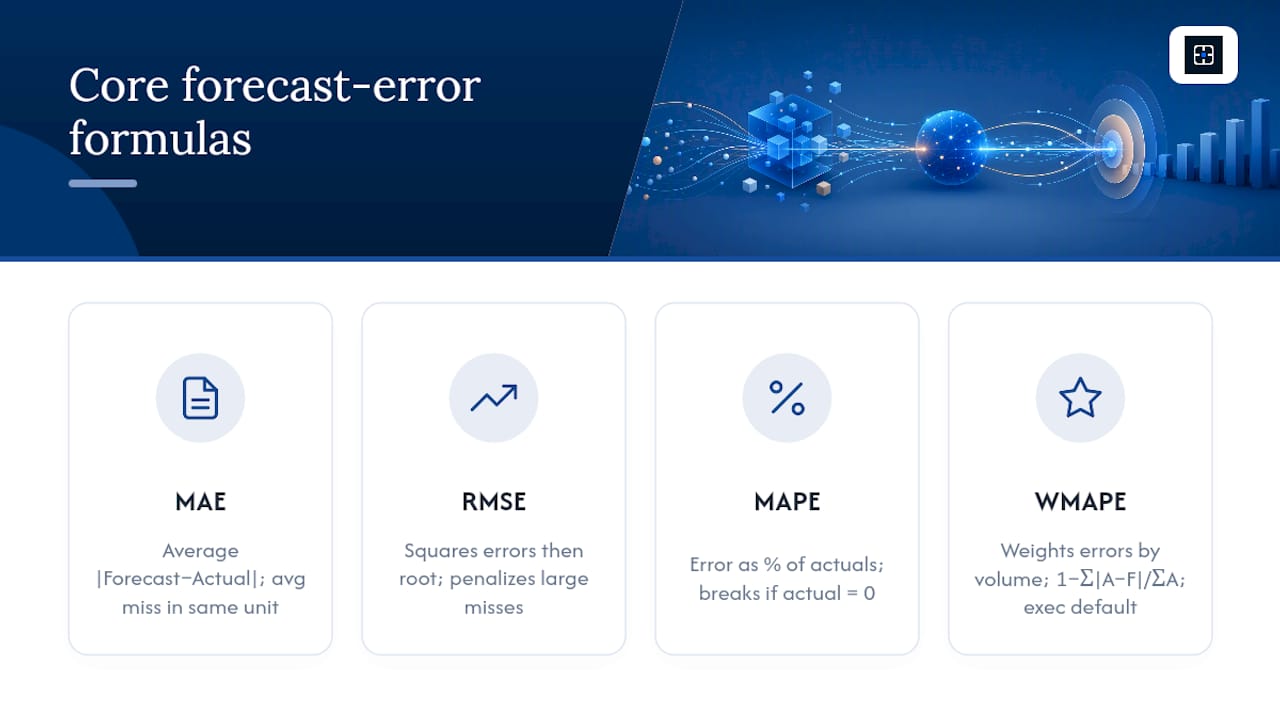
MAE (Mean Absolute Error), also called MAD (Mean Absolute Deviation): averages the absolute size of your misses, in the original units. If you forecast units, dollars, or deals, MAE tells you the average miss in that same unit. Formula: MAE = average of |Forecast − Actual|. In Excel, with forecasts in column B and actuals in column C:
=AVERAGE(ABS(B2:B13-C2:C13))
as an array formula, or use a helper column for absolute error first, then =AVERAGE() on that column. MAE is easy to explain to a room full of non-statisticians, which is exactly why it works for operational planning.
RMSE (Root Mean Square Error): squares each error before averaging, then takes the square root. That squaring step punishes large misses far more than small ones, so RMSE is the metric that catches the one enormous miss a MAE average can hide. Formula in Excel:
=SQRT(AVERAGE((B2:B13-C2:C13)^2))
MAPE (Mean Absolute Percentage Error): expresses error as a percentage of actuals, which makes it easy to compare across products or regions with different scales. Formula:
=AVERAGE(ABS((B2:B13-C2:C13)/C2:C13))*100
The catch: MAPE breaks when any actual value is zero, since you cannot divide by zero. Hyndman’s research recommends masking zero-actual periods or switching to a scaled error instead of forcing MAPE through them.
WMAPE (Weighted MAPE, also called WAPE): fixes MAPE’s biggest flaw for business reporting by weighting errors by volume, so one small deal’s huge percentage miss doesn’t distort the whole picture. Formula:
=SUM(ABS(B2:B13-C2:C13))/SUM(C2:C13)*100
WMAPE-based accuracy is often written as 1 − Σ|Actual − Forecast| ÷ ΣActual, summed across every item and period. That single formula is generally the safest default for executive dashboards, because it reflects actual pounds and pipeline, not the average of a lot of small percentages that don’t add up to the business reality.
Two related metrics worth knowing: MASE (Mean Absolute Scaled Error) compares your forecast error against a naïve baseline, and works even when actuals include zeros. sMAPE (symmetric MAPE) tries to fix MAPE’s asymmetry but has its own distortions near zero. Neither replaces the four core formulas above for routine reporting, but both matter when you’re forecasting intermittent or low-volume series where MAPE simply cannot be trusted.
How to build a forecast accuracy check in Excel
You don’t need a statistics package. A six-column spreadsheet does the job.
- Lay out your columns: Period, Forecast, Actual, Error, Absolute Error, Percentage Error.
- Calculate Error:
=Forecast-Actualin each row. - Calculate Absolute Error:
=ABS(Error). - Calculate Percentage Error, with a zero-guard:
=IFERROR(ABS(Error)/Actual,"")so a zero-actual period returns blank instead of an error. - Add summary cells below the table: MAE is
=AVERAGE()on the absolute error column. RMSE is=SQRT(AVERAGE(Error^2)). MAPE is=AVERAGE()on the percentage error column, ignoring blanks. WMAPE is=SUM(Absolute Error)/SUM(Actual). - Add a “zero count” sanity cell:
=COUNTIF(Actual_range,0). If this number is more than a handful across your periods, MAPE is unreliable and you should lean on WMAPE or MAE instead.
For multi-item forecasts (multiple SKUs or reps rolled into one view), sum the absolute errors and sum the actuals across all items before dividing, rather than averaging individual item-level MAPEs. Averaging percentages across items of wildly different sizes produces a number that flatters small, volatile items and hides large ones.
Pro Tip: Add conditional formatting to the absolute error column, flagging anything above roughly two times your MAE in a highlighted colour. This turns a static accuracy report into a quick visual scan for which specific periods or deals need investigation, rather than a single number nobody interrogates.
Practitioners recommend evaluating forecasts on genuine hold-out periods rather than in-sample fit, a method known as rolling-origin evaluation, as covered in Forecasting: Principles and Practice. Testing your formula against data the model has already seen tells you nothing useful.
Which formula to use for which decision
The formula you choose should match the decision it’s informing, not just what’s easiest to calculate.
- Executive and board reporting: use WMAPE. It’s volume weighted, so it reflects real revenue exposure rather than an average of many small percentage misses.
- Safety stock and replenishment planning: use MAE or MAD. Planners need to know the average miss in units, not a percentage, to size buffer inventory correctly.
- Capacity planning and risk of a single large miss: use RMSE. Its squaring penalty surfaces the one deal or one SKU that blew the forecast apart, which an average-based metric can bury.
- Per-SKU or per-deal percentage review: use MAPE only when zero-actual periods are rare. Where zeros are common, scaled errors or MAE are the more honest choice.
Whatever metric you settle on, publish the grain and horizon alongside it, and show bias (whether you consistently over or under-forecast) next to accuracy.
What accuracy numbers actually hide, and what to do about it
A single accuracy figure at company level is close to a vanity metric. If the number that reaches the board doesn’t disaggregate to the level where decisions actually get made (SKU by week, rep by quarter), it isn’t telling you where to act.
Zero-actual periods are the second recurring trap. When a product hasn’t shipped yet, or a deal category has no historical actuals, MAPE returns an error or an absurd spike. The fix isn’t to force the formula through; it’s to switch to MAE or a scaled error for that segment, or to explicitly exclude zero periods and say so in the reporting notes.
Accuracy and bias are not the same diagnosis. A forecast can be reasonably accurate on average while being consistently optimistic, and that pattern is the one that erodes trust with a board fastest.
- Drill into the top five contributors to absolute error each period before presenting the aggregate number.
- Test your forecast against a naïve baseline (last period’s actual, or a simple trailing average) to confirm your model is adding real value.
- Where evidence supports it, combine forecasts from more than one method. Evidence-based forecasting research shows combined forecasts can cut error substantially compared with relying on one single method.
Pro Tip: Before you present an accuracy number to leadership, ask what decision it’s supposed to inform. If nobody can answer, the number is decoration, not evidence.
Why traceable scoring makes accuracy numbers defensible
Most revenue teams don’t have an accuracy problem. They have a traceability problem. A forecast misses, someone asks why, and the honest answer is a shrug: the model said what it said.
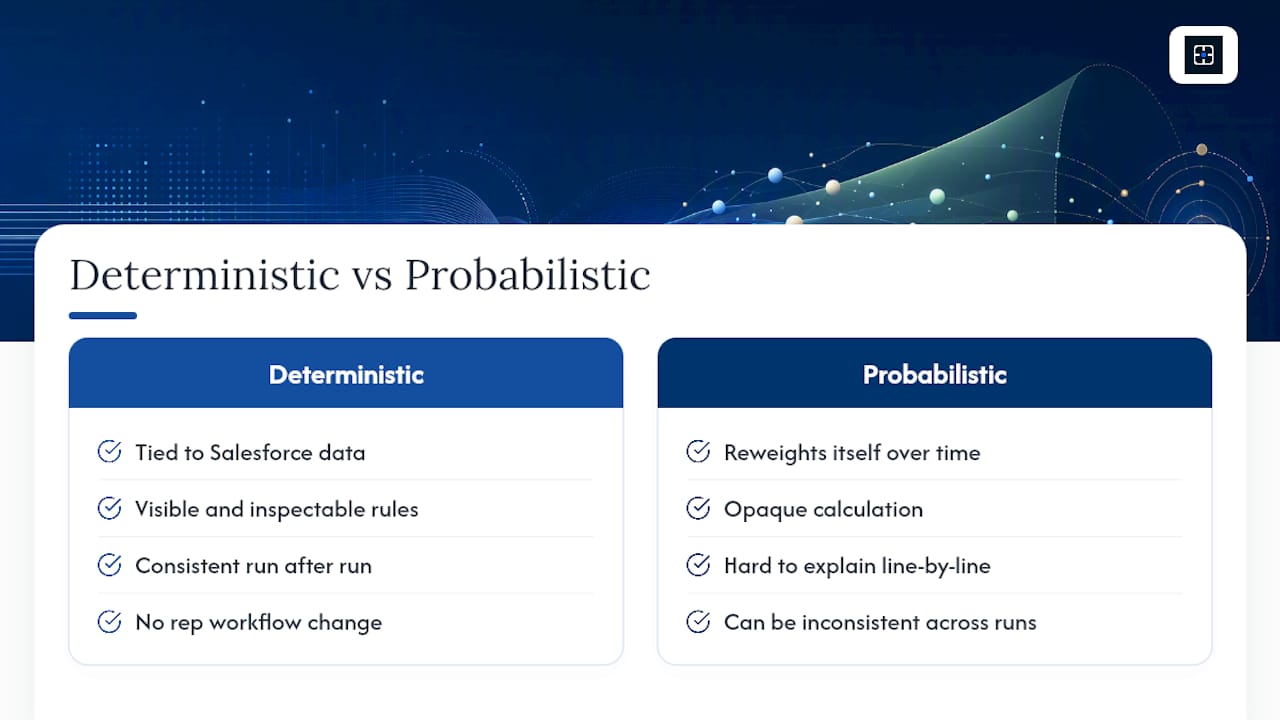
Deterministic scoring removes that shrug. The same inputs always produce the same score, and every signal that feeds a deal’s score is tied directly to activity already logged in Salesforce: a stage change, a stalled task, a missing next step. When a commit is missed, you can point to the exact change that caused the variance instead of gesturing at a black box.
That matters because most vendors in this category run probabilistic models that output a confidence percentage with no visible reasoning behind it. Enterprise tools can be accurate on average and still fail the one test a board actually applies: “why did this deal slip, specifically?” Commitcontrol was built around answering that question directly.
- Every score traces back to a Salesforce field or activity, not a hidden weighting.
- A human owns each logs any override, and that override is logged, not silently absorbed into the model.
- Teams evaluating a leadership change can use the sales leadership transition approach to reset a forecast on evidence rather than a new leader’s gut feel.
What VPs and CROs should demand before trusting any accuracy figure
Don’t accept a bare percentage. Ask what grain and horizon it was measured at.
Ask for a simple back-test: does the vendor’s own model beat a naïve baseline on your historical data, or just on theirs? Ask whether every input that produced a given commit score is something you could pull up and check yourself, in Salesforce, in under a minute. If the answer requires trusting a black box, you’re buying a probability, not a number you can defend.
— Brian
A practical option if you’re tired of defending numbers you can’t explain
A deterministic deal scoring solution ties deal scores directly to Salesforce data, so every input behind a forecast is visible and consistent, run after run, with no rep workflow change required.

If your forecasting stack currently produces a confidence score you can’t walk a board member through line by line, that’s a critical gap. Unlike a probabilistic model that quietly reweights itself, a deterministic scoring system stays fixed to rules you can inspect, and every score is traceable to a specific CRM signal, not an opaque calculation.
Start by putting a number on what forecast misses are actually costing you with the sales forecast miss ROI calculator, or explore how deterministic scoring works if you’re mid-way through a sales leadership transition and need a forecast reset built on evidence rather than a fresh guess. Pricing is structured for the whole team, not per seat, so cost doesn’t climb every time you add a rep to the platform.
Sources
For the formulas themselves, Forecasting: Principles and Practice by Rob Hyndman and George Athanasopoulos remains the standard, freely available reference. Hyndman’s own paper on forecast accuracy covers the MAPE zero-division problem in detail. For the evidence behind combining forecasts, see the Wharton evidence-based forecasting checklists. On measurement uncertainty generally, NIST’s technical note on accuracy terminology is a useful grounding text.
- Forecasting methods and principles: Evidence-based checklists
- Forecasting: Principles and Practice (3rd ed)
- Forecast accuracy (Rob J. Hyndman)
FAQ
What is the formula for calculating accuracy?
Forecast accuracy is generally calculated as 1 minus your chosen error metric: for WMAPE, that’s 1 − (Σ|Forecast − Actual| ÷ ΣActual). The exact formula depends on whether you’re using MAE, RMSE, MAPE, or WMAPE.
How do I measure forecast accuracy in Excel?
Build columns for Forecast, Actual, Error, Absolute Error and Percentage Error, then summarise with =AVERAGE(ABS(...)) for MAE, =SQRT(AVERAGE((...)^2)) for RMSE, and =SUM(ABS(...))/SUM(Actual) for WMAPE.
What counts as a good forecasting accuracy figure?
There’s no single universal benchmark, because it depends heavily on grain, horizon and industry volatility. A more useful test than chasing a target percentage is comparing your accuracy against a naïve baseline and checking whether bias is consistently one-directional.
Is there a built-in forecast formula in Excel?
Excel includes a FORECAST.LINEAR function for generating trend-based projections, but it doesn’t calculate accuracy on its own. You measure accuracy separately, by comparing that forecast against actuals using MAE, RMSE, MAPE or WMAPE.
Why does Commitcontrol focus on WMAPE and traceability rather than a single accuracy score?
Because a single aggregate figure hides where a forecast actually broke. Commitcontrol ties each deal’s score to specific Salesforce activity, so when accuracy drops, you can trace the exact change responsible rather than accepting an unexplained variance.
Recommended
Editorial content. All metrics are Salesforce-derived and reviewed for accuracy. Not a substitute for professional judgment.
See the same discipline applied to your pipeline.
CommitControl derives every figure from your own Salesforce data. Nothing is invented, and every number traces back to the record it came from. Connect Salesforce and the same view runs live on your data within 24 hours.
Evaluate CommitControl